Poster
Client Context
Our client is Northside Hospital Gwinnett, which is part of the larger Northside Hospital system. Northside Gwinnett is a not-for-profit hospital, meaning that they pour any profit back into their own system. We worked with their Emergency Department (ED), which has 70 beds and 191 employees.
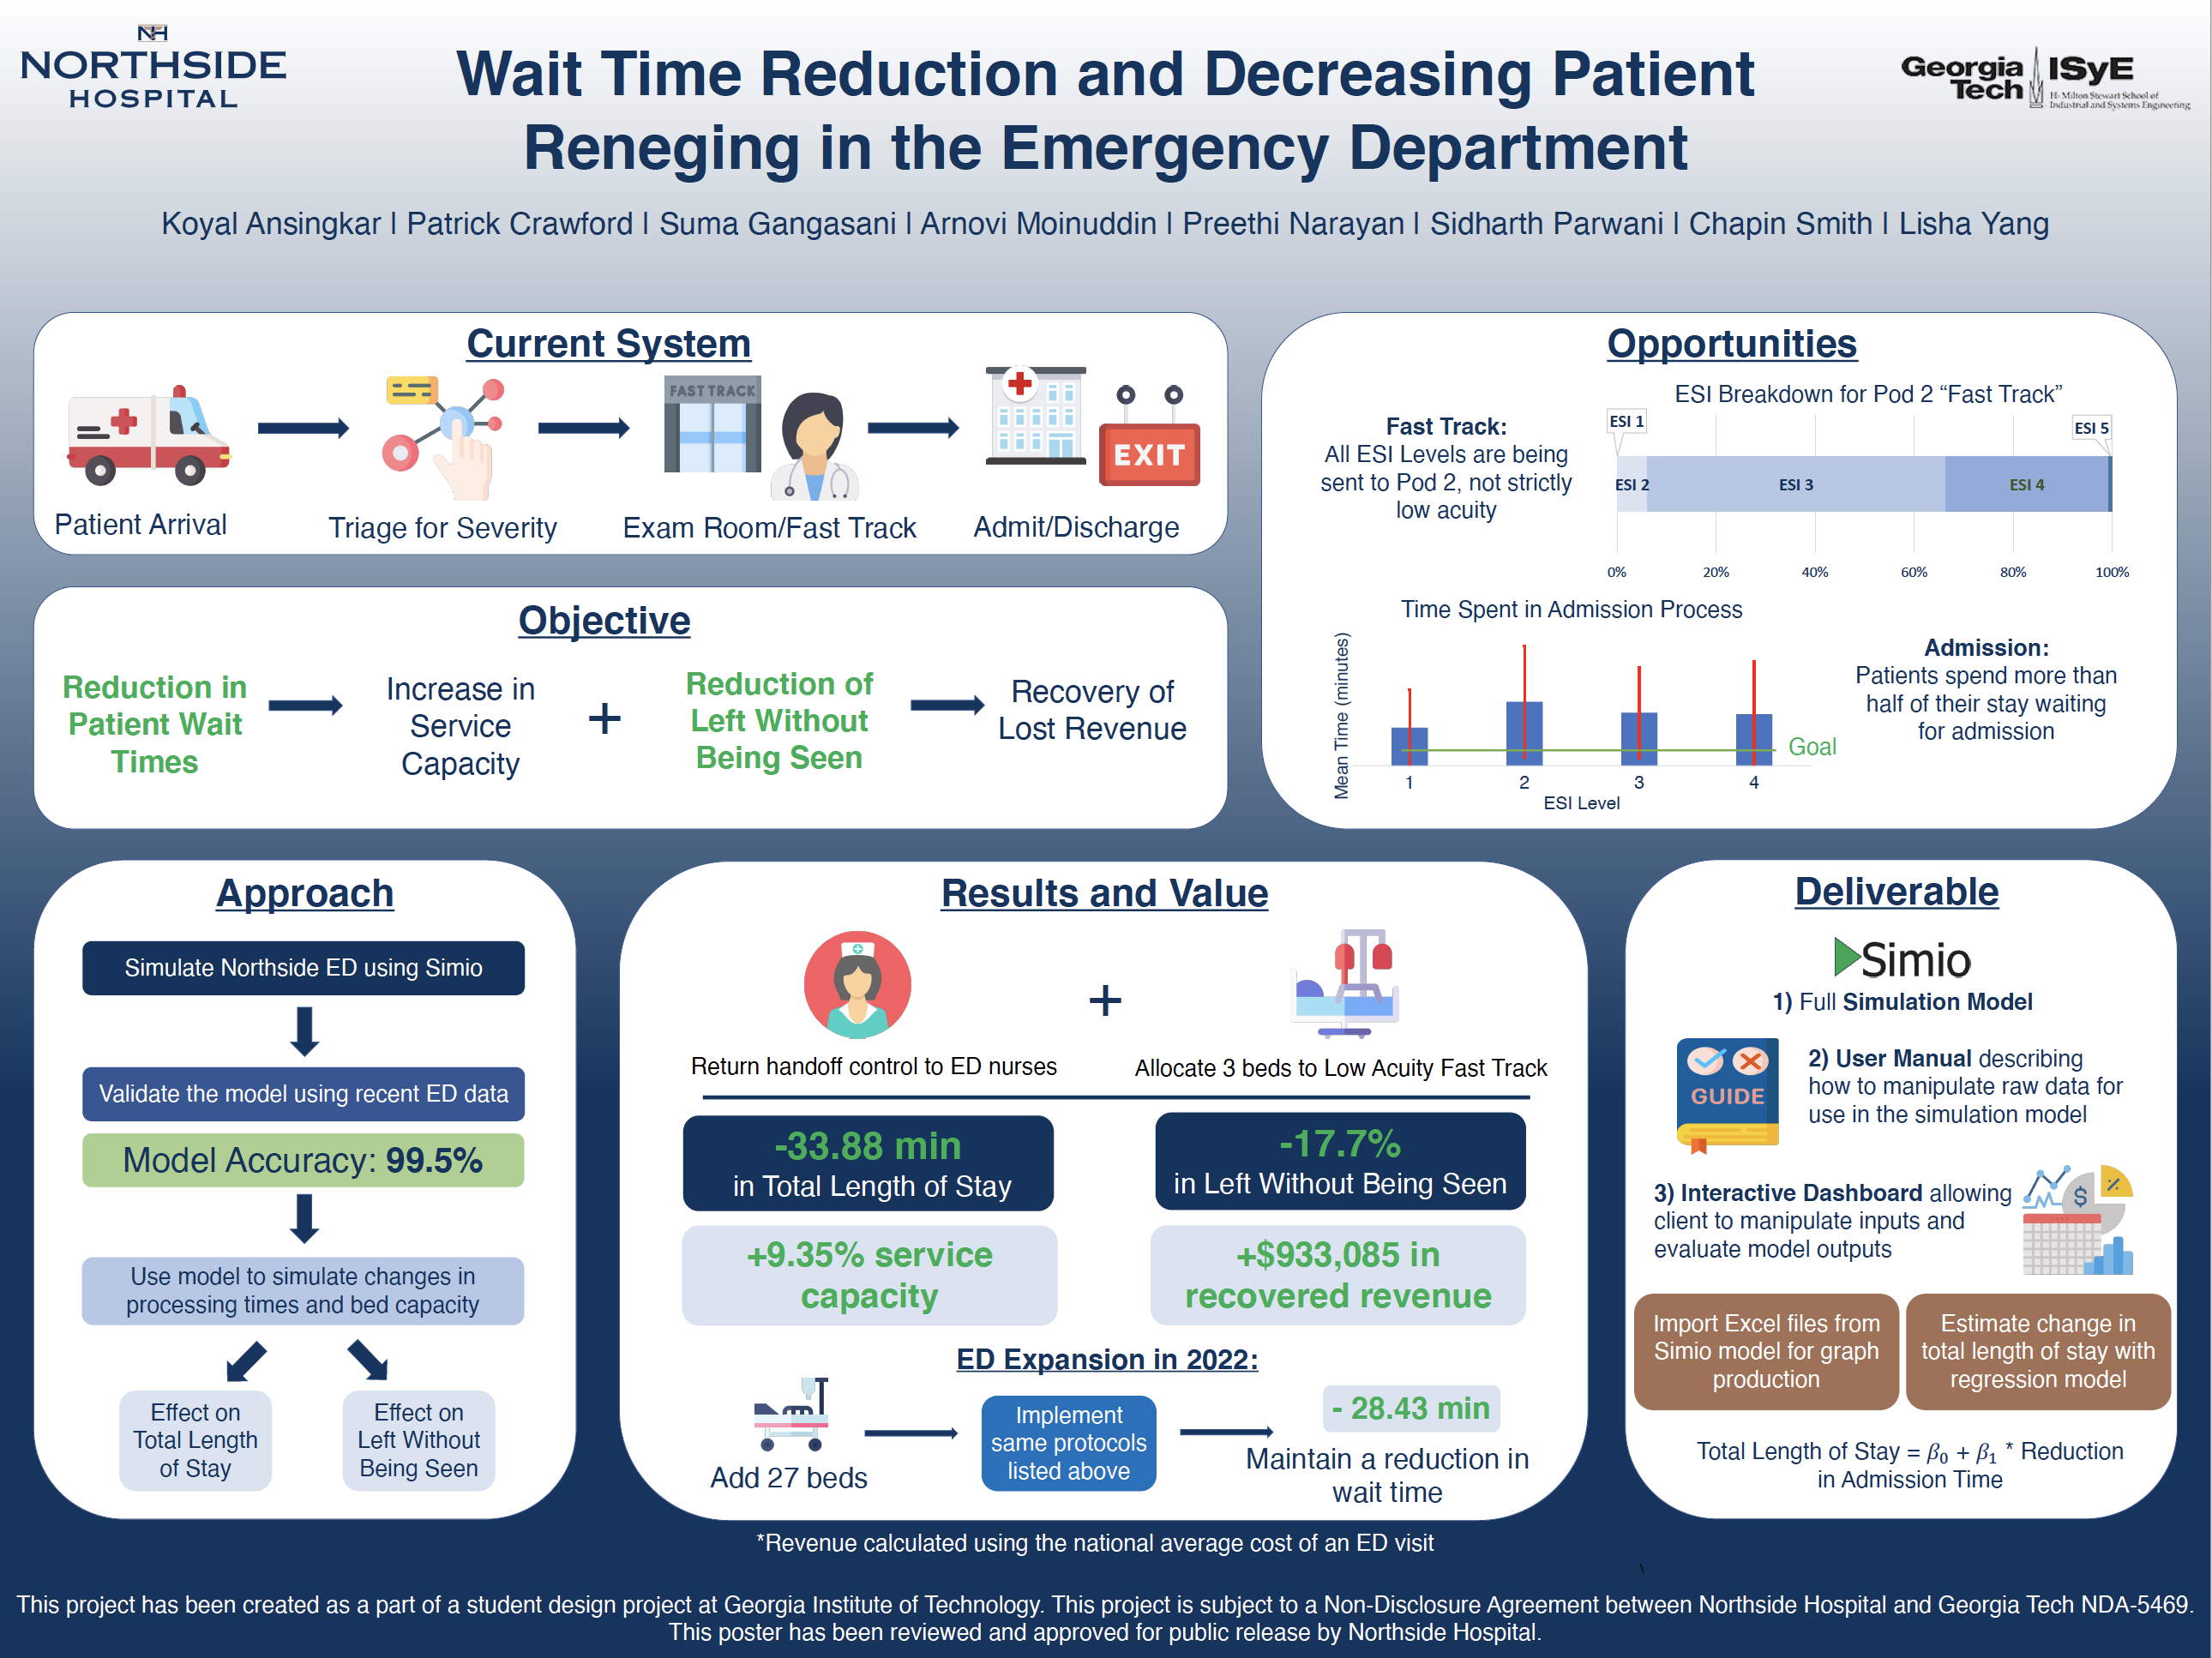
Patients check in upon arrival to the ED. They will then go through primary triage to be assigned their Emergency Severity Index, or an “ESI level” or “acuity level.” The ESI level is on a scale from 1 to 5, with 1 being the most severe. Depending on their ESI level and bed availability, patients will either go to the waiting room or to a room in one of two treatment spaces: the exam halls or Pod 2. Once in a treatment space bed, patients are then seen by a provider. The provider is usually an ED physician, but for lower severity patients, the provider can be a nurse practitioner or physician’s assistant. After seeing the patient, the provider will determine their disposition, or their decision about the next steps for that patient. The provider’s disposition will either recommend that the patient be admitted to the general or in-patient hospital or be discharged from the ED. The patient will then complete the corresponding exit process: the discharge process or admission process.
Project Objective
Northside Gwinnett is motivated by the excess in average total length of stay (abbreviated to “TLOS”), or cycle time, for patients that are to be admitted into the in-patient hospital, and the percentage of patients that make the decision to leave without being seen (“LWBS”) by a physician. During the timeframe of our dataset, which lasts from September 2020 to January 2021, Northside Gwinnett’s ED is exceeding their internal goal for TLOS by 56.7% and their goal LWBS rate by 1.8 percentage points.
Our objective was to make recommendations that will decrease patient wait times and the percentage of patients who leave without being seen by a physician. Decreased wait time will be a result of shortened average total length of stay, as the longer a patient occupies a bed than necessary, the longer a new patient must wait to be seen by a physician. Decreased wait times will also increase the overall service capacity of the ED, meaning the system will be equipped to handle higher arrival rates.
After multiple site visits, rigorous data analysis, and industry research, our team uncovered two major areas of opportunity: developing a “fast track” strategy for Pod 2 to increase treatment rate and turnover of low severity patients, and making process design changes to the patient admission process.
Pod 2 was originally intended to be a fast track for lower severity patients. However, due to stress on the system from high patient volumes, in actuality Pod 2 serves as a general treatment area for all patients. After some analysis of recent patient-level data, it was found that patients of all ESI levels are treated in Pod 2. Higher ESI level patients such as ESI 1s and 2s, on average, take much longer to treat. As a result of higher severity patients taking up beds in Pod 2, several lower severity patients are treated in the Exam Halls due to lack of space in Pod 2. Our focus was on reorganizing the fast track by determining how many beds should be reserved for low severity patients.
On the back end of the system, we saw large delays in between when a provider decided to admit a patient to the in-patient hospital and when the patient would exit the ED system. Our data analysis showed that the admission process exhibits high variability and, on average, accounts for more than half of an admitted patient’s total length of stay. Northside Gwinnett’s ED is exceeding their internal goals for the average amount of time the admission process takes. From conversations with our client and our own site visit observations, we found that admitted patients often experience idle time at the very end of their ED visit as they wait to be retrieved by an in-patient hospital nurse. Our focus was to revisit this patient transfer process to reduce admission time and subsequently TLOS.
Design Strategy
Our design methodology involved the creation of and experimentation with a simulation of the ED patient flow system.
In the simulation model, patients arrive based on arrival rates we calculated for each ESI level, hour of the day, and day of the week. Patients are served at a check-in server and then proceed to the waiting room. When beds become available, the highest priority patients are routed from the waiting room to a treatment space server on a priority basis of waiting time and patient severity. Patients are then treated or processed at a treatment space server. Processing times varied with patient ESI level, whether a patient was an admission or discharge patient, and whether the patient was treated in Pod 2. Some patients in the model decide to leave before treatment and are classified as LWBS patients.
The simulation model was validated by comparing several key metrics against the Northside Gwinnett ED’s patient-level data. Four specific metrics that we used to validate our model were: TLOS, LWBS, the time between arrival and when a patient is seen by a doctor (we refer to this metric as “ArrivalToMD”), and the time between when a patient is seen by a doctor and when they exit (we refer to this metric as “MDSeenToExit”). Our model performed within 1% of real data for overall TLOS.
We designed experiments to determine the effects of implementing a stricter fast track strategy and the effects of changing the admission process. For the fast track experimentation, we manipulated the number of beds that high severity patients were not allowed to go to. For the admission process experimentation, we decreased the treatment space processing time for admitted patients in small increments and noted the reductions in average TLOS. From this experimentation, we created a regression model correlating reduction in admission process time to reduction in overall average TLOS. As part of our combined fast track and admission time reduction experiment, we found that dedicating 3 beds for fast track patients exhibited the greatest reduction in average TLOS.
Upon further data analysis and discussion with the client, we discovered that the client had changed their admission process protocol in January of 2020. The previous protocol was for ED nurses to take admitted patients from the ED to the in-patient hospital. The current protocol is for in-patient nurses to retrieve admitted patients from the ED and take them to the in-patient hospital. Our analysis of the admission process times pre- and post-protocol switch showed that the average admission process time actually increased by 40 minutes after the protocol switch.
Deliverables
Our deliverables include two recommendations and a decision support tool to be used for future analysis and decision-making at the ED.
Our recommendations include implementing a strict 3-bed fast track in Pod 2, and empowering ED nurses to transfer admitted patients to the in-patient hospital. Based on simulated results, these recommended changes can have positive impacts on the ED system and bring Northside Gwinnett’s ED closer to their internal goals for TLOS and LWBS rate.
Our decision support tool allows the client to run their own experiments with our simulation model based on new or different data. The decision support tool consists of three elements: a Python script for preparing data, the simulation model, and an interactive Excel dashboard for analyzing simulation results.
The client can feed new or different patient-level data into our python script, which will use the data to fit processing time distributions and determine probabilities necessary for the simulation model. The Python script will output an Excel file with the values and tables necessary for the simulation model.
The simulation model has an option to import tables and values from Excel. Using our documentation and instructions in our deliverable user manual, the client can then run custom experiments. The output of those experiments can be directly imported into the last element of the decision support tool, the interactive Excel dashboard.
The Excel dashboard displays key metric comparisons across all the experimental scenarios. Metric comparison graphs include: TLOS, LWBS, ArrivalToMD, MDSeenToExit, and the average number of patients in the ED. With these graphical comparisons, the client can quickly and easily determine which experimental scenarios exhibited the most improvements, and which scenarios exhibited negative effects. Along with graphical comparisons, the dashboard includes descriptive statistics for those metrics as well if the client is looking to dive deeper into the data. An interactive representation of the regression model of the correlation between admission time and TLOS is also included so that the client can quickly estimate changes in regards to those two metrics.
Project Information
Student Team
Koyal Ansingkar
Patrick Crawford
Suma Gangasani
Arnovi Moinuddin
Preethi Narayan
Sidharth Parwani
Chapin Smith
Lisha Yang
Faculty Advisor

Faculty Evaluator