Poster
Client Context
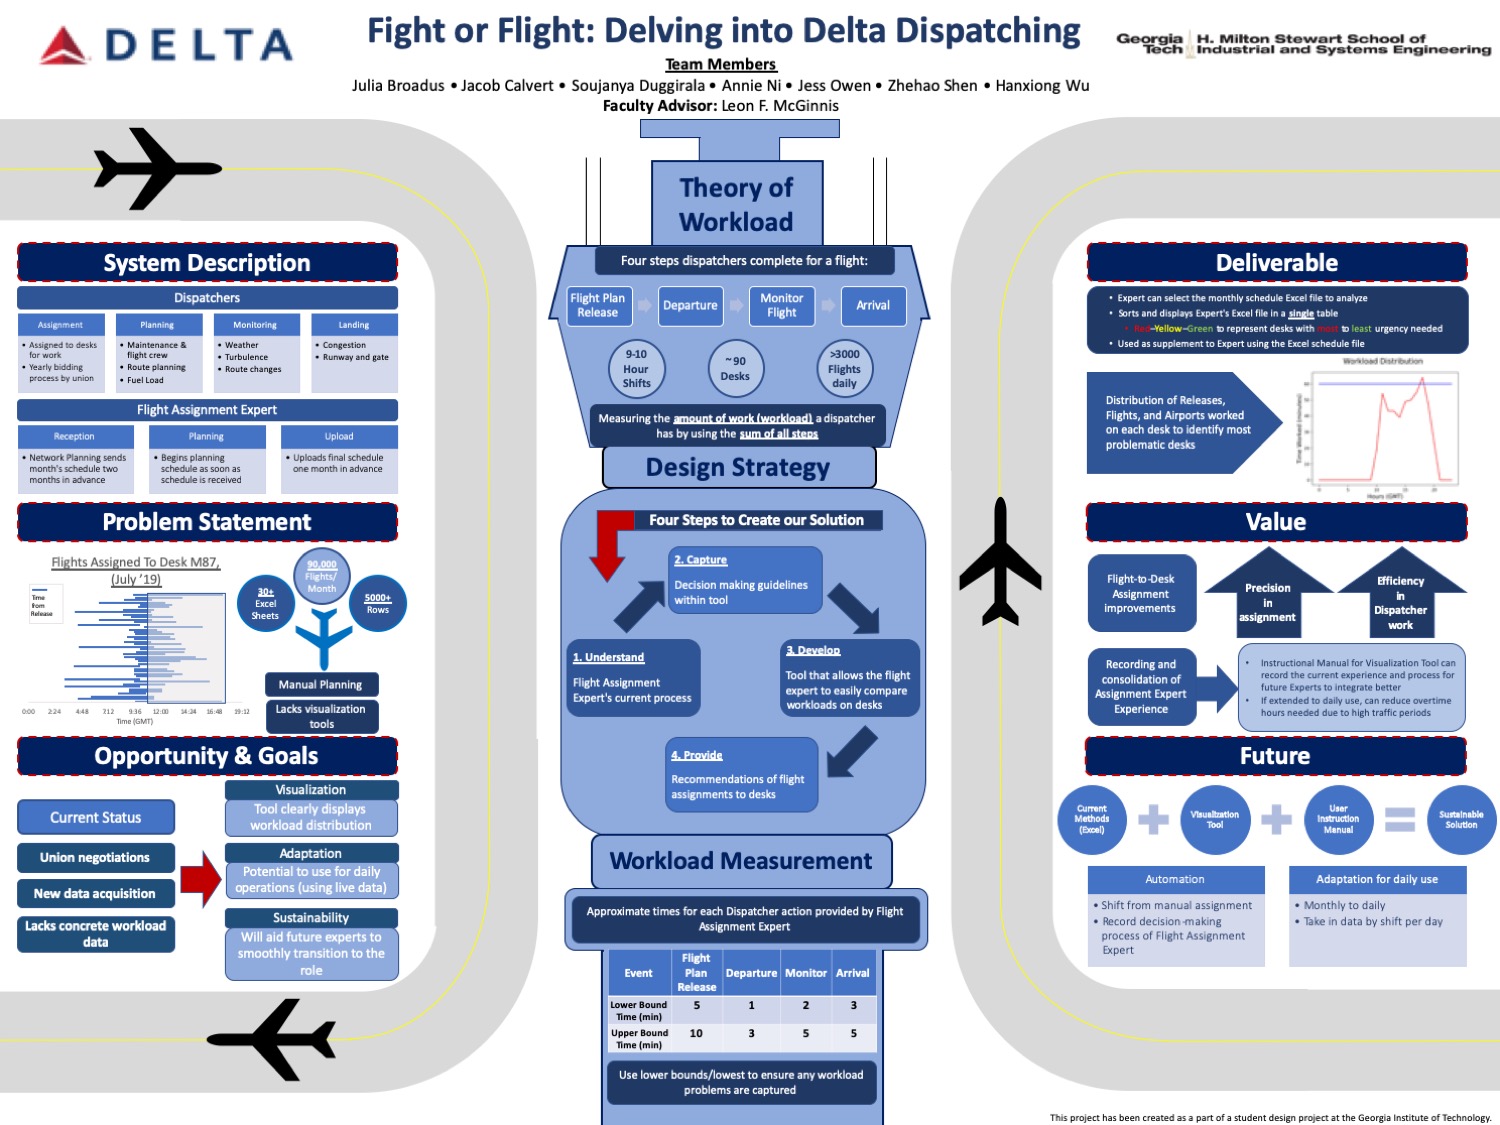
The client is Delta’s Operations and Customer Center, located near the Atlanta Airport. Specifically, the subject of interest is Delta’s flight assignment expert.
This expert is tasked with planning 90,000 flight assignments to 90 desks each month. A “flight assignment” pairs a flight to a dispatcher desk. All planning is done in a single Excel workbook with approximately 30 + sheets. There are three different shifts throughout a day and these shifts can begin and end at different times. The flights assigned to a desk shift creates workload, and the expert’s objective is to evenly distribute this work across all desks.
The file the expert currently uses does not provide the flight assignment expert any way to visualize the workload generated at a desk from the planned assignments. As a result of the lack of functionality, the process of assigning flights to desks is quite laborious.
Project Objective
One of the goals of this project is to provide a way to visualize the workload distribution at a given desk’s shift. The expert does not have a way to easily pinpoint the problematic desk shifts and the flights associated with them and lacks a tool that can provide insight on how to solve these problems.
This visualization tool was developed specifically for the needs of the flight assignment expert when a large quantity of flights is manually assigned to desks. Because the expert is assigning flights based on operational expertise using a single Excel file, the processes that the expert must go through are important to record for sustainability. Thus, we aim for the tool to be a sustainable solution for future staff changes so that the current expert’s assignment process can be visualized for the next expert. In addition, this tool expedites the expert’s process of assigning flights which will help him make better decisions.
Design Strategy
The first step was to understand the current work processes of the dispatchers and the flight assignment expert. Then, the flight assignment expert’s daily process was captured and quantified, such as certain metrics and constraints the expert attempts to track in the assignment spreadsheet. Next, the tool was developed using Python.
The tool allows the expert to upload the Excel file, enter in specific desk numbers and the day(s) to be viewed. The desk view has three columns containing metrics the expert finds the most useful when planning. Each value is either green (under capacity), yellow (approaching capacity) and red (above capacity). The expert can then type in the desks’ ID and visualize the workload generated at the desk(s). Three graphs are shown: the workload, number of releases, and number of stations assigned across the desk’s shift. The expert can also compare different desk’s graphs.
The tool will be used in conjunction with the expert’s Excel file. If the expert notices a desk that needs a flight to be reassigned to a different desk, the expert can change the assignment in the Excel file and click a “Refresh” button on the Desk View Page and the metrics and graphs will update accordingly. The tool is fully implemented and working.
The expert gave feedback on the tool during a preliminary demo and at the final presentation. The client said the tool is very insightful and they were impressed with how many details the tool considered, especially in dealing with handoffs and shift times. The expert was particularly pleased that the graphs reflected the workload at desks that often report about higher workload, and that the graphs paint a picture of the situation at a desk.
In addition, the tool is much faster than some of the analytics processes used now. The tool has not yet been incorporated by the client, but there was discussion at the final presentation about integrating it into their planned workload management tool. The final feedback was that the tool is going to be a big help to them and that this tool will have an impact on Delta customers and change the method of operation in the Operations and Customer Center.
Deliverables
- The project deliverables include the workload visualization tool made using Python and a user manual containing instructions for how to utilize the tool. The tool’s ability to provide workload visuals will aid the expert in making more accurate and efficient flight assignments. The user manual provides instructions on how to run the tool and adjust the tool if more flight information needs to be added.
- Next steps include building a recommendation portion that Delta is considering adding it to the tool. This part of the tool will show the flights that are at a selected desk; if the desk is above capacity (or has metrics above the assignment constraints), then a set of new candidate desks will be recommended that the expert can move flights to.
- Further recommendations include performing time studies to gather more information about what exactly contributes to workload and extending this tool from planning to tactical use as well (or for day-to-day reassignments on the dispatcher floor).
Project Information
Student Team
Julia Broadus
Jacob Calvert
Soujanya Duggirala
Annie Ni
Jessica Owen
Zhehao Shen
Hanxiong Wu
Faculty Advisor

Faculty Evaluator