Poster
Client Context
Our client is responsible for importing and distributing industrial products. They must import these products, or purchase orders (POs), from East Asia to the US along shipping lanes, or pairs of origin-destination ports. To do so, they must choose a carrier company which will transport the POs. Each carrier company charges different prices, or rates, for each lane. HD Supply normally wants to choose the cheapest carrier rate to ship each PO on. However, there are two types of carriers – direct carriers and NVOC (spot) carriers. Direct carriers have prenegotiated contracts with HD Supply that encourage HD Supply to ship a certain number of POs with that direct carrier on a lane every year. Though these contracts are not legally enforceable, following them is helpful for maintaining good relations with the direct carriers to keep agreed-upon rates. Spot carriers, on the other hand, have no contracts with HD Supply and HD Supply has no obligation to ship with them. They do so only when these spot rates are cheaper than direct rates.
Project Objective
HD Supply uses one analyst to manually allocate POs to ocean carriers each week. This process typically takes 3-5 hours each week and is based on the knowledge and intuition of the analyst. Because the system is limited to one analyst’s decisions and intuitions, cheaper decisions can be made with a standardized process. Another source of motivation comes from changes in spot and direct rates. These shifting rates create room for additional cost savings. Spot rates are now lower, so HD Supply wants to fulfill enough of their direct contracts as to not raise red flags, and the send remaining POs on cheaper (spot) rates. The overall objective is minimizing cost while deciding which carriers to send POs with each week. These decisions are subject to constraints related to fulfilling direct carrier contracts and respecting available space on all carriers.
Design Strategy
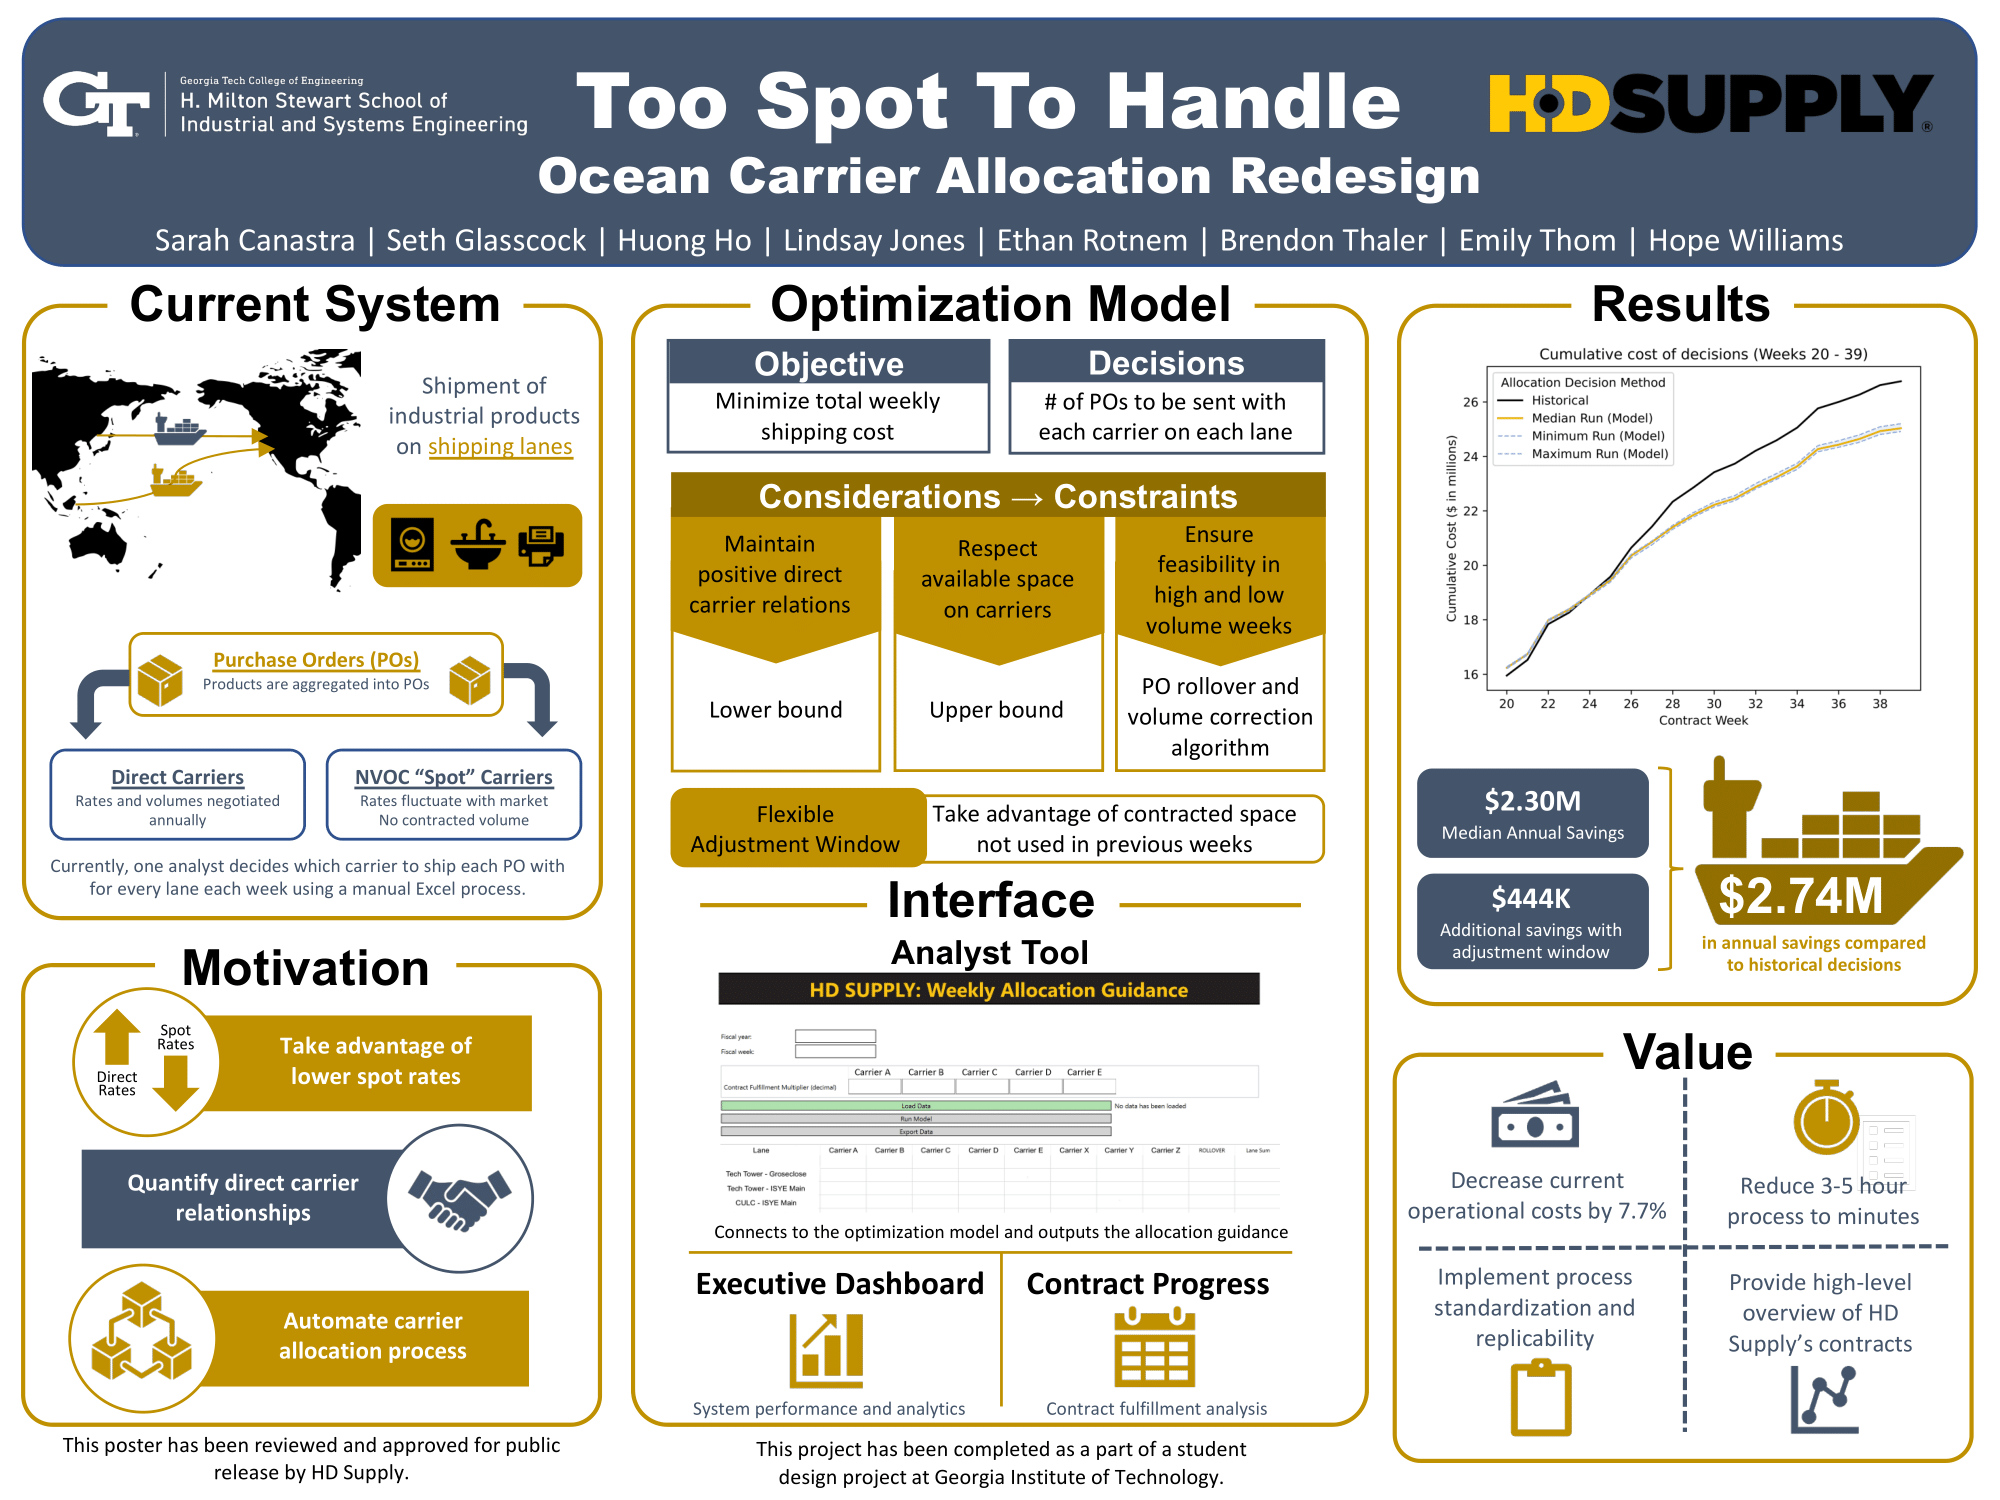
With the client’s objectives in mind, we began designing a solution that would accommodate these needs. It became clear early on that developing a model was the best choice to ensure these needs were met. This model enforces a minimization objective function while also accounting for all previously mentioned constraints. Another source of value we implemented is a toggle to increase allocations on direct carriers. This toggle is intended to be used to take advantage of unused space in previous weeks when there is high volume in the current week. In order to interact with the model, we also decided to build an interface that would allow any HD Supply analyst to quickly run the model, get insights about its performance, and monitor their contract allocation with direct carriers.
We were able to test this model and interface solution with 39 weeks of HD Supply’s data. Our results saved money, as detailed in the value section, but also respected all constraints we had. We were able to validate our model by examining its results and seeing that they made logical sense in the context of the system.
Deliverables
Python Optimization Model – Considers contract parameters, space policies, and recent allocations to allocate POs in such a way that minimizes cost while keeping both hard and soft constraints into consideration.
PyQt6 Graphical User Interface – An executable file that utilizes 6 free python modules for the analyst to run. This provides the analyst a space for all the inputs necessary for running the optimization model. The interface will display the week’s results, while also displaying the total cost. Additionally, the interface provides the client with visibility into system performance statistics and current progress across all the direct carrier contracts.
Value and Impact
After testing the model against historical allocations and replicating the target fulfillments, the model saves a projected $2.30 million annually. Turning the toggle on brings the annualized savings to $2.74 million. The range across the best and worst-case model performance scenarios was only $288,000 over 39 weeks. This is a 14% risk, but the model saves over $2.08 million annualized in the worst performance case of 225 replications. Additionally, the team’s model runs in less than a minute, saving the 3-5 hours the analyst was spending on allocation. The savings as well as added value from automation and standardization of an originally tedious allocation process are providing immediate value to HD Supply.
Project Information
Student Team
Sarah Canastra, Seth Glasscock, Huong Ho, Lindsay Jones, Ethan Rotnem, Brendon Thaler, Emily Thom, Hope Williams
Faculty Advisor

Faculty Evaluator