Poster
Client Context
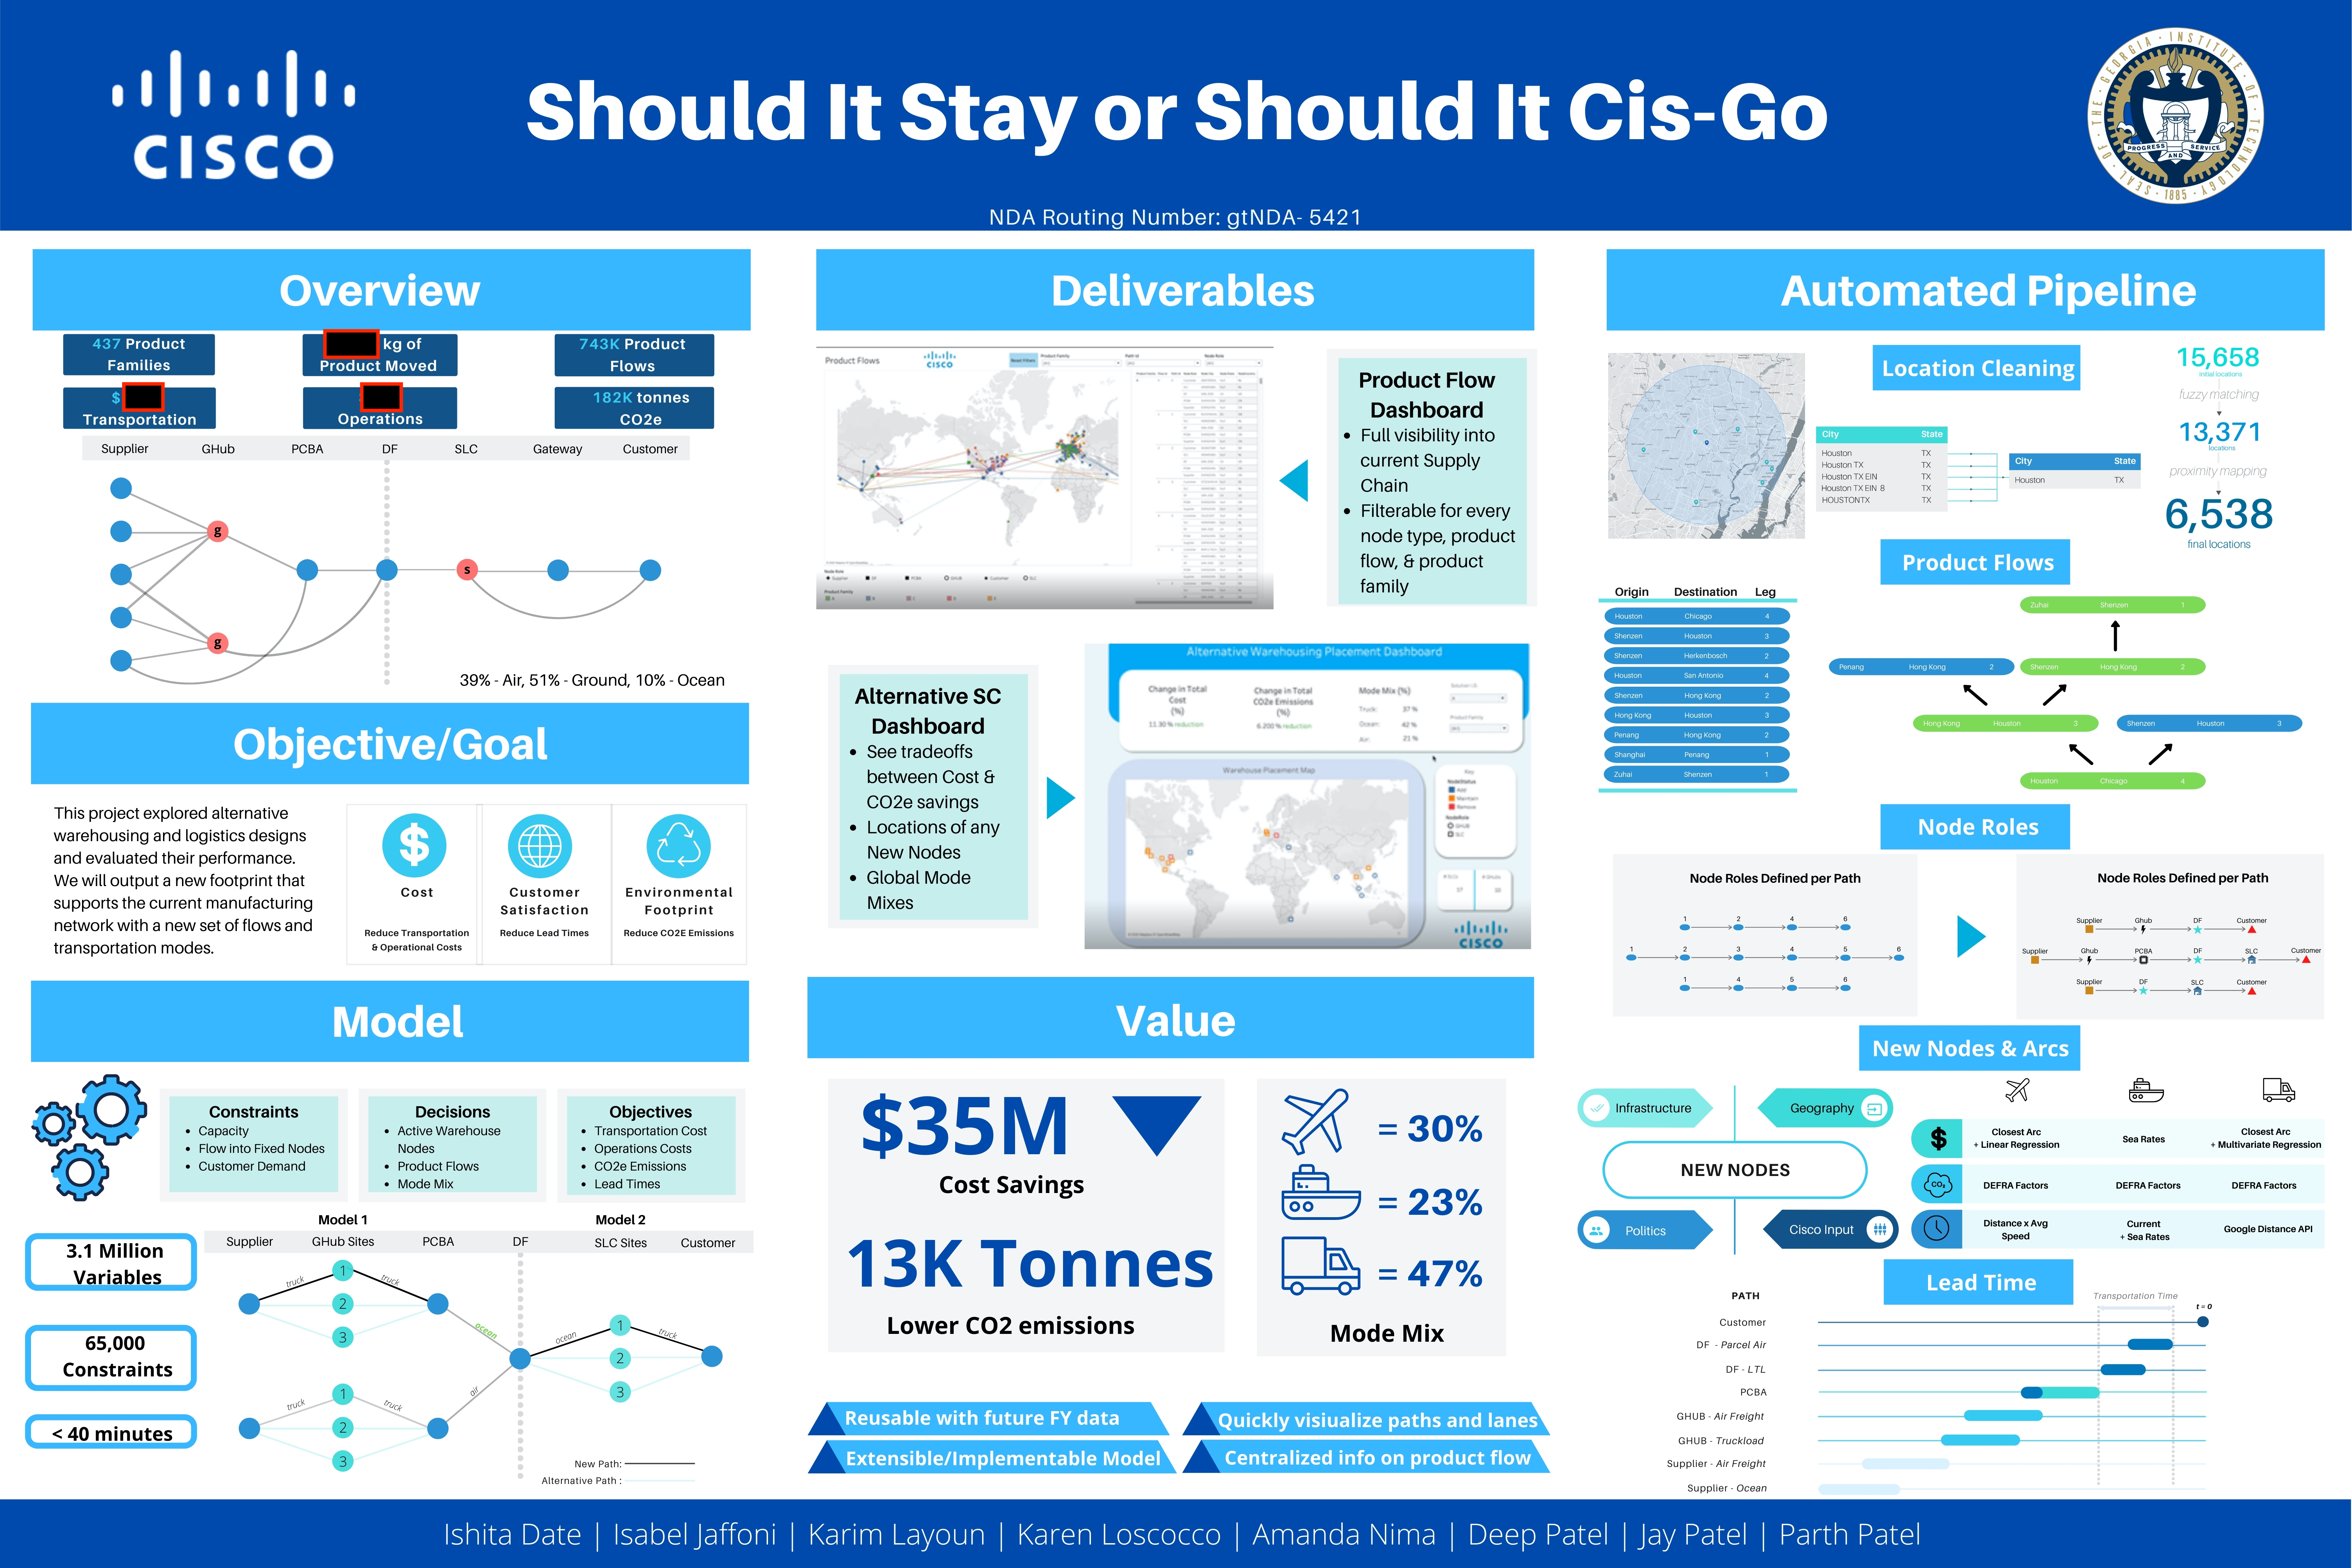
Cisco Systems Inc. is a multinational technology conglomerate headquartered in San Jose, California that develops, manufactures, and sells IT and networking solutions. The department of Global Manufacturing and Logistics at Cisco is responsible for network design and the management of manufacturing operations, warehousing, and logistics for 437 product families. The large number of shipments Cisco makes each year result in significant transportation and operations costs as well as thousands of tonnes in carbon dioxide emissions.
Project Objective
The goal of the project is to determine if the location of warehousing nodes and the one-to-one geographic pairing of warehousing and manufacturing nodes is ideal. Network designs are evaluated according to transportation and operations cost, carbon emissions, and customer satisfaction measured by lead time. This project explores alternative network designs that present a variety of trade-offs between these objectives and presents 3 deliverables to enable Cisco to make decisions about their global supply chain.
Design Strategy
A Mixed Integer Mathematical Programming model (MIP) has been implemented for optimizing the layout design. To model the system, we needed to identify the set of nodes and arcs in Cisco's current supply chain as well as define an alternate set of nodes and arcs for the model to consider. We also needed to extrapolate the costs associated with the operations of new nodes and costs and the environmental impact of new arcs. Although it is infeasible to test model outputs in the real-world using the scientific validation method, the model was validated by conducting simple experiments with expected outcomes.
With a major focus on allowing Cisco to utilize our model formulation for future analyses, our approach included setting up a repeatable data pipeline for all data cleaning, processing, and transformation. This pipeline includes all steps required to run the model and then view model outputs in our delivered visualization tools from raw Cisco data.
Deliverables
The team created three main deliverables. The first was an interactive Tableau dashboard that gives visibility into Cisco’s present supply chain operations. This enables them to see over 740,000 unique product flows and filter based on product family and node type. It also helps Cisco realize inefficient product flows in their current supply chain such as a product path that crosses the Pacific Ocean twice.
The next deliverable is a tableau dashboard that visualizes the performance of a set of alternative network designs. The dashboard shows performance in terms of cost and carbon emissions, mode mix, and the network map associated with each solution. Because all 3 KPIs are important to Cisco stakeholders, over 60 model runs, with varying objective weights were used to generate a set of Pareto optimal solutions and an associated Pareto frontier. Within the frontier, Cisco can choose a solution based on their current business priorities. The dashboard is also filterable for different scenarios that allow for various levels of capital investment. Cisco would be able to see the tradeoffs from altering their current network design when adding one node, two nodes, or only by altering the transportation mode mixes.
The next deliverable is the optimization models, along with the necessary data cleaning and transformation steps, melded into an automated pipeline. The many data algorithms transform any fiscal year invoice data into a consistent, transparent, and informative data source. And the optimization models let Cisco run as many different scenarios as they want, even as their supply chain changes. Cisco may evaluate changes and variations to their global supply chain and customer demand, and realize their impact on product routing, warehousing network and use, transportation mode mix, cost, customer satisfaction, and the environment; all under 15 min.
Project Information
Student Team
Ishita Date | Isabel Jaffoni | Karim Layoun | Karen Loscocco | Amanda Nima | Deep Patel | Jay Patel | Parth Patel
Faculty Advisor

Faculty Evaluator