Poster
Client Context
Steelcase is a publicly-owned American manufacturer of furniture for workplaces, schools, hospitals, and residential interiors. They are based in Grand Rapids, Michigan, and have six plants in North America. Our primary contact at Steelcase is with the Product Development and Launch (PD&L) team. The PD&L team is responsible for the developing new products, and they launch about 30-60 new products each year. PD&L has expressed a desire to integrate data into their supplier selection process for new products.
Project Objective
Choosing the suppliers for a product line has consequences for the bottom line; choosing a supplier that is likely to produce defective parts or a supplier that consistently delivers products late can lead to poor quality in the final product and/or costly delays to that product's launch. However, determining a supplier's risk level is not straightforward. When there is no purchase history with a supplier, there are increased uncertainties in that supplier's future performance. New suppliers may appear desirable to work with from their initial assessment, but their true performance can only be measured once production has begun. Because of this uncertainty in both quantifying and predicting supplier performance, Steelcase has largely relied on word-of-mouth and "tribal knowledge" to assist in these supplier decisions. And while qualitative supplier features gained from a supplier's industry reputation are also critical toward predicting a supplier's future performance, our client expressed a desire to incorporate quantitative metrics as well, as they have emphasized their belief that their subjective process has previously led them to make suboptimal supplier selections. In this project, we have identified two main opportunities where we can use quantifiable metrics to improve the decision-making process for Steelcase's new product launches.
With this project, we can:
-
Compare the relative performance of existing suppliers in Steelcase’s portfolio to provide recommendations for which supplier is best suited to supply a given part, and
-
Revamp the new supplier qualification process so that initial qualification metrics are more meaningful when predicting future performance.
Design Strategy
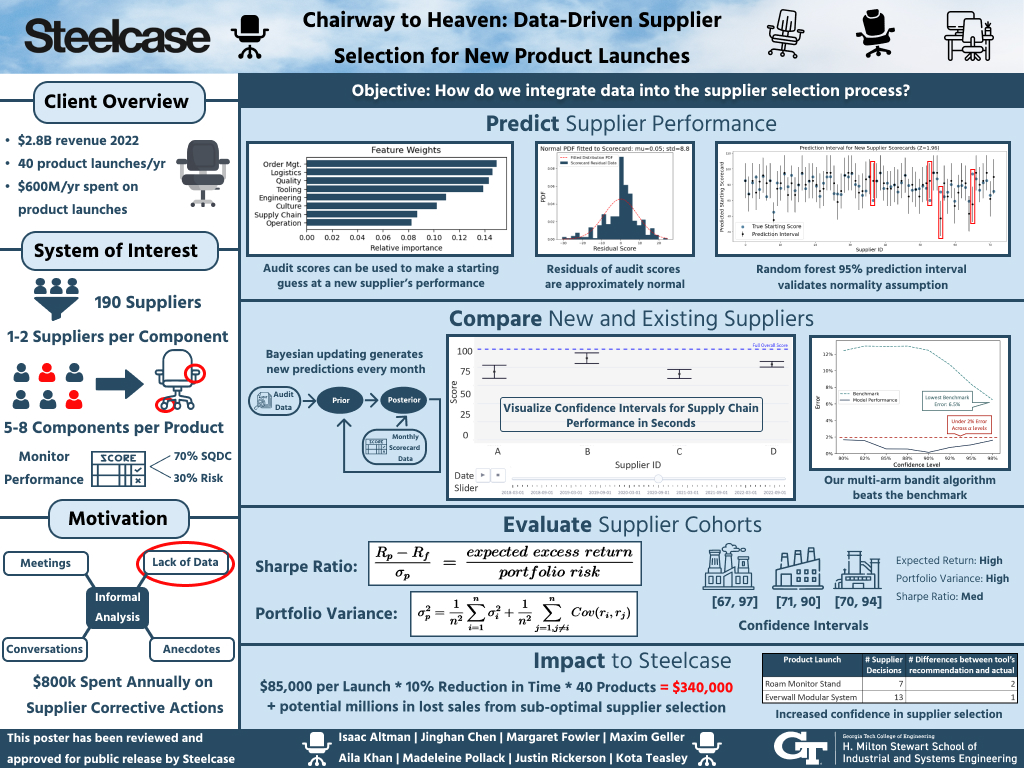
To improve the initial audit of a new supplier, we performed an analysis relating a supplier’s initial audit data to their future monthly scorecard data. The dataset for the analysis contained 70+ unique supplier operational excellence assessments (OEA) conducted by Steelcase. The features considered were the supplier’s score in each of the assessment categories of the OEA. Each of the models trained on 80% of the dataset and the remaining data was held-out to test on the final selected model. The random forest had the highest R-squared and lowest mean-squared error, though its performance is comparable to the decision tree.
The feature importance plot created from the random forest provides insight into which OEA categories are the most indicative predictors of scorecard performance, which is important for understanding the utility of the OEA itself. Steelcase has agreed that the relative importance of "Order Management and Scheduling," "Logistics and Inventory Management," and "Quality Systems" intuitively make sense as being the most important issues since they have to do most with the primary KPIs they track: reliability (OTD), and quality (DPPM).This information can be used to estimate a new supplier’s performance since the OEA can inform a prior distribution of the expected supplier performance. If Steelcase needs to add a supplier to its portfolio to enable a product launch, the PD&L team can have a much better understanding of the risk of using the new supplier and how they might perform relative to similar suppliers.
Now that a new supplier’s prior distribution on expected performance can be initialized, we can compare new and existing suppliers on the basis of their projected performance. Our back-end algorithm uses a Thompson Sampling framework which leverages Bayesian updating to model performance distributions contextually based on observed data.
Thompson Sampling starts each round with a "prior" distribution derived from the previous information that has been collected on the supplier. This can include both the initial prior calculated from our random forest model as well as monthly scorecard data collected in previous rounds. We then use the most recent monthly scorecard score to update our prior distribution and calculate our posterior distribution for the supplier. Since both our prior and posterior distributions belong to the family of normal distributions, we can use conjugate distributions to update our beliefs.
We decided to use the Normal-Inverse Gamma conjugate prior distribution in our algorithm because it works with normal priors where the true μi and σi of the supplier are unknown. We also included exponential time weighting into our updating algorithm to prioritize recent information. In each round, the Normal-Inverse Gamma conjugate distribution outputs a posterior predictive. By mapping this posterior predictive to a confidence interval, we can visualize the performance and uncertainty associated with different suppliers in a way that is not possible by looking at the scorecards alone. This also gives us a common language for comparing suppliers with different amounts of data.
With our Bayesian updating algorithm, we can accurately compare the predicted performance of individual suppliers. In practice, Steelcase not only wants to use our predictions to compare suppliers but to evaluate the strength of entire supply chains. We use the Sharpe Ratio to represent the risk-adjusted performance of a cohort of suppliers. The Sharpe Ratio is traditionally used in finance to represent the risk-adjusted performance of a portfolio of investment products and is calculated as S = E[Rp−Rf ] where Rp is portfolio return, Rf is the σp risk-free rate, and σp is the portfolio standard deviation. We altered this formula for our use case by defining S =μp where μp is the average predicted performance calculated by our Bayesian updating algorithm and σp σp is a portfolio variance metric. The Sharpe Ratio is a relative metric where a portfolio with a higher score has a higher risk-adjusted performance than one with a lower score. Steelcase can use this score to track supply chain performance over time and evaluate candidate supply chains for a new product.
Deliverables
-
OEA Recommendation Paper: Formal recommendation report that addresses the opportunity of a revamped qualification process by outlining our analyses of the current OEA and our recommendations for improving its predictive capability.
-
Decision Support Tool: Streamlit app that assists in supply chain analysis and supplier selection. This tool addresses the opportunity to compare supplier performance to create optimal portfolios for a product's supply chain.
Value and Impact
The overall impact of these deliverables is quantified in several ways. The PD&L team estimates that both deliverables lead to a 10% time reduction for the new product launch process, saving the company around$340,000 in direct labor costs. However, this dollar amount does not encompass all of the potential savings that come from avoiding supply chain disruptions and having to switch out problematic suppliers once production has started, which can cost the company tens of millions of dollars in unrealized revenue. For the first time, Steelcase can use real performance data to make informed supplier selection decisions.
Project Information
Student Team
Isaac Altman, Jinghan Chen, Margaret Fowler, Maxim Geller, Aila Khan, Madeleine Pollack, Justin Rickerson, Kota Teasley
Faculty Advisor

Faculty Evaluator