Poster
Client Context
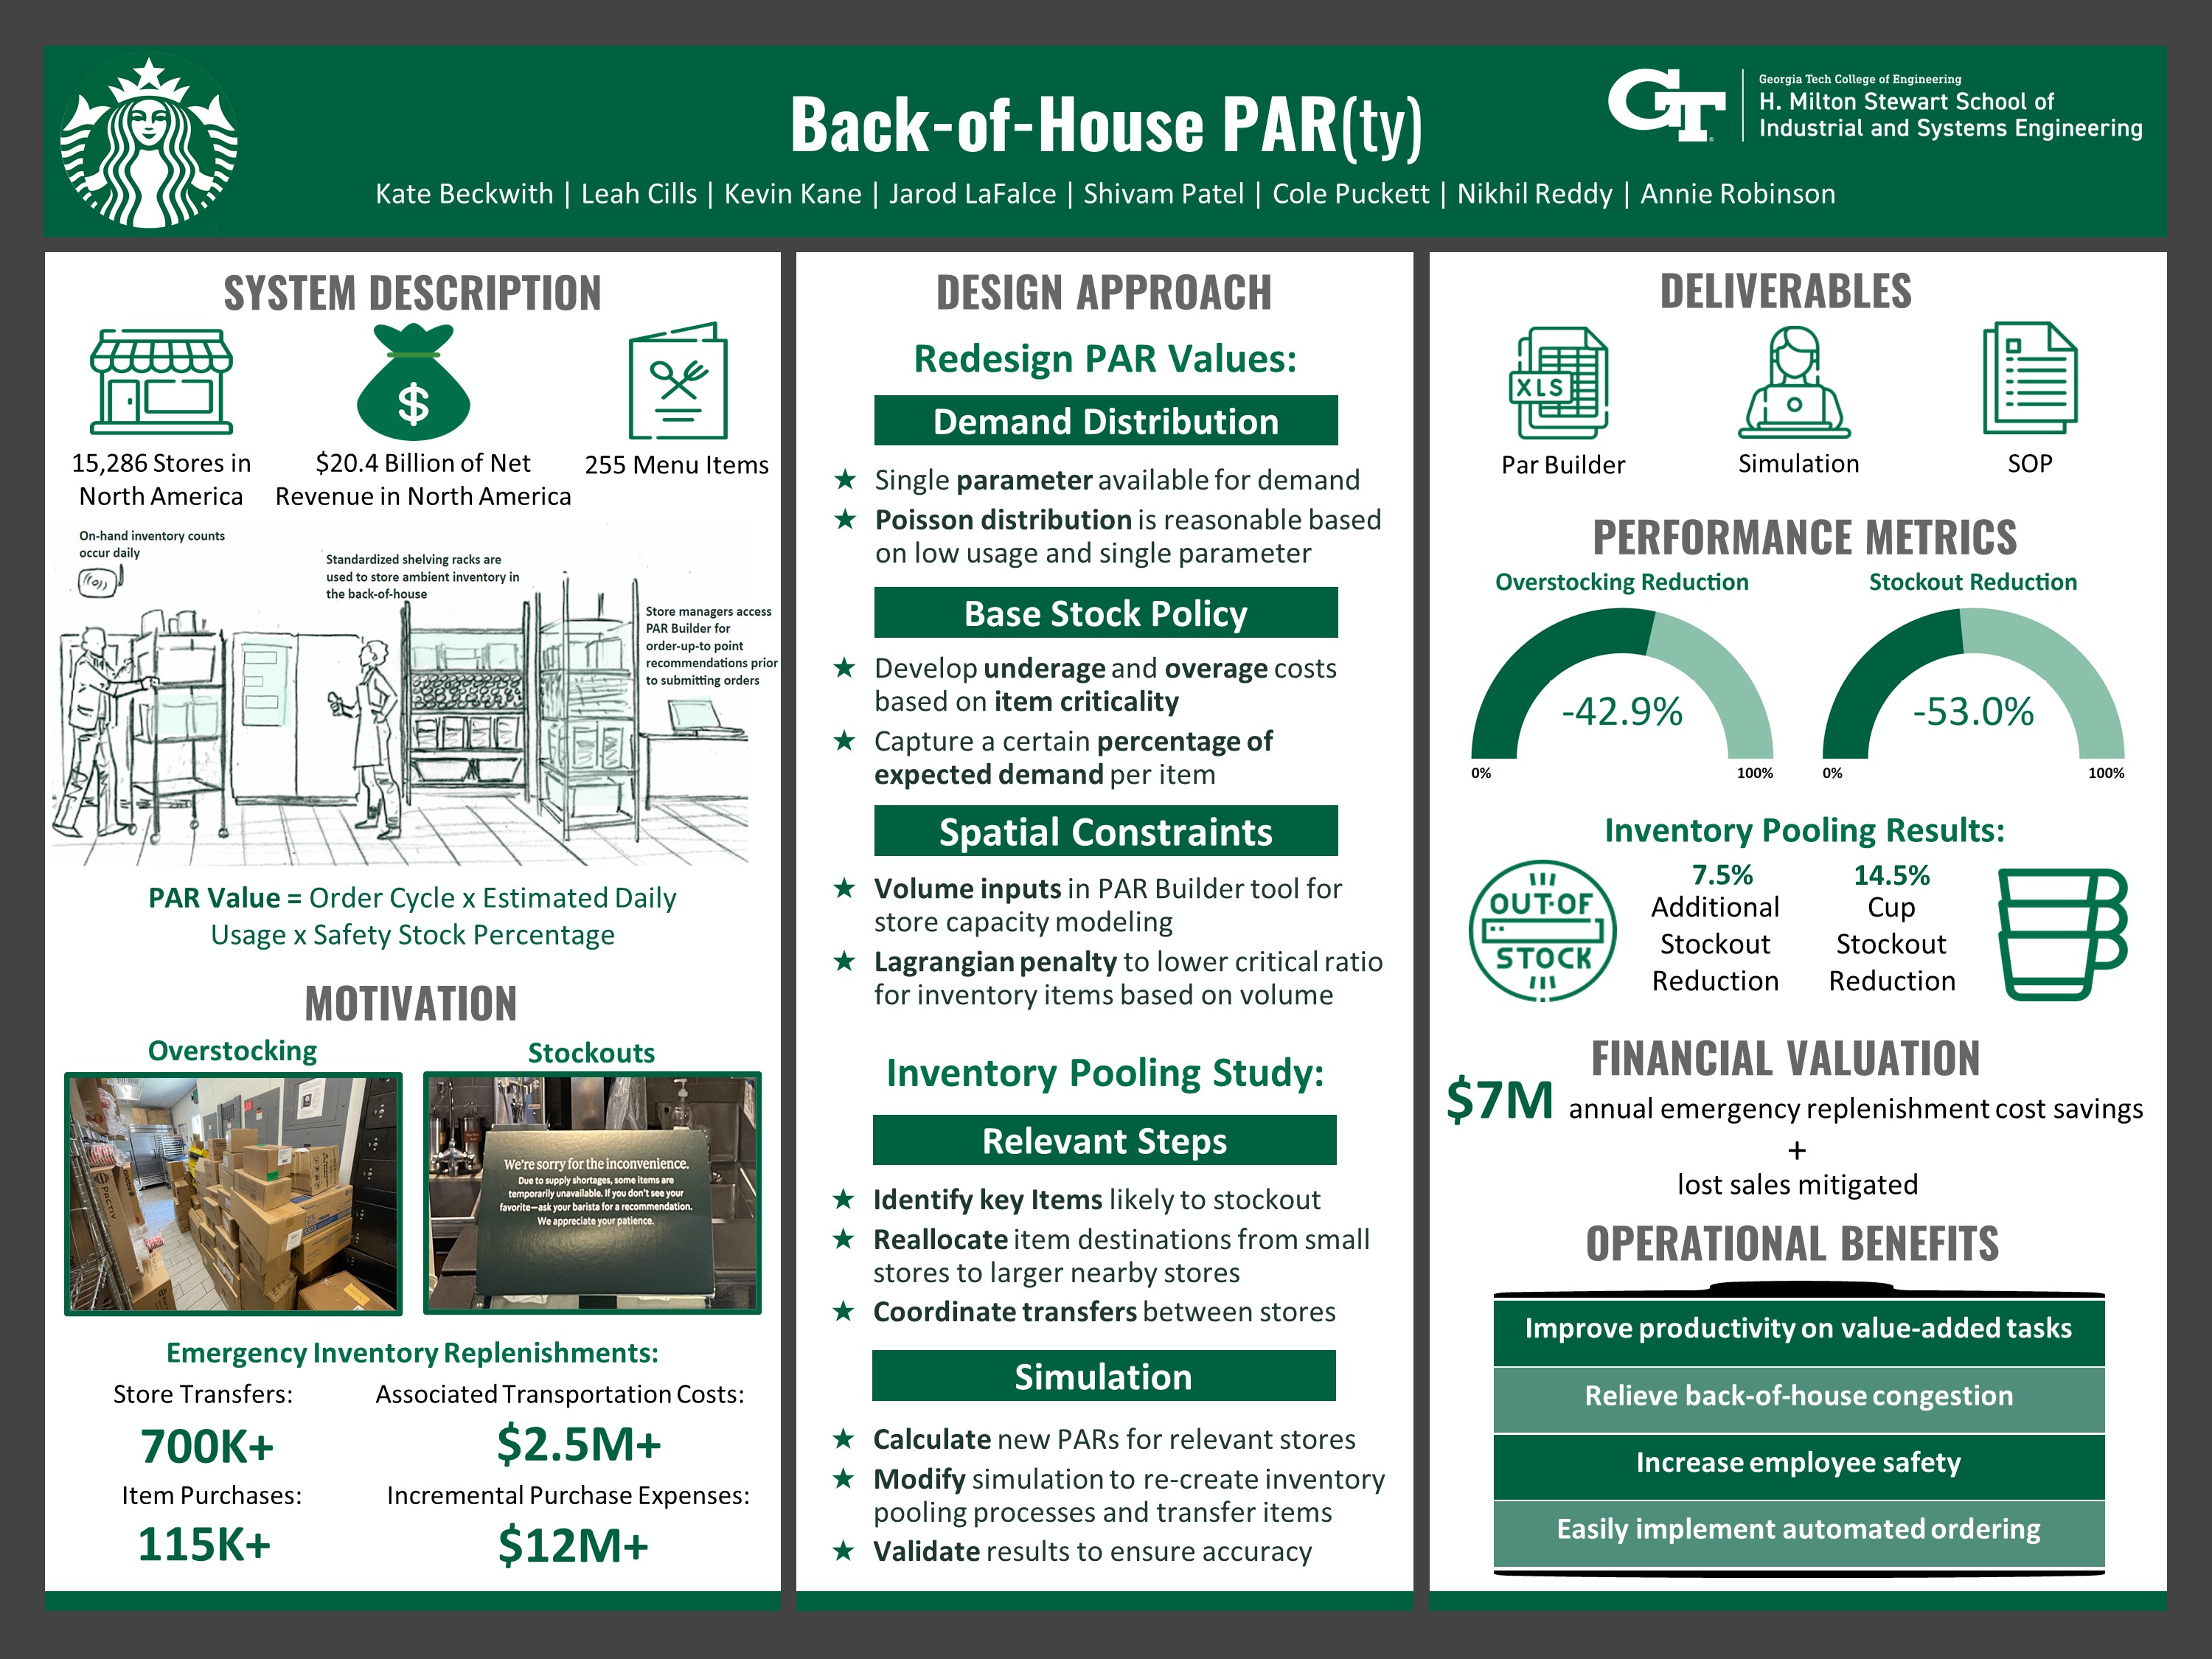
Starbucks Corporation, the world’s largest coffeehouse chain, requires a complex supply chain to ensure that all 15,286 stores in North America have the necessary goods to meet the demand of their consumers for their 255 menu items. The team worked with Starbucks’ End-to-End Inventory Flow team, which focuses on process improvements within the inventory cycle. The team analyzed stores within Starbucks' Atlanta District as this enabled in-person visits and was a good representation of most districts by having a range of stores with varying capacities.
Project Objective
The team redesigned the method for calculating PAR values (order-up-to values) for Starbucks' non-refrigerated inventory. The original PAR values did little to account for the probabilistic nature of customer demand and did not account for the space available at each store to hold inventory. This results in overstocking and stock-outs at stores. Overstocking makes it difficult for employees to navigate a congested back-of-house, store important inventory, and risks potential fire hazards as boxes are put in unauthorized areas. Understocking results in missing sales and additional costs for Starbucks as they attempt to replenish inventory from other local Starbucks stores and supermarkets. A conservative estimate by the team found that these emergency replenishment methods result in over $14.5 million in additional annual costs.
Design Strategy
The first step in redesigning the PAR values was finding a probability distribution to model item demand. The team chose the Poisson distribution because there is only a single parameter available for demand and the estimated daily usage for most products is under 10 units. Next, the team calculated underage and overage costs on the inventory, based on Starbucks’ item criticality classification, to determine a critical ratio that helps determine the percentile of demand to capture. Finally, the capacity of the store was inputted so a Lagrangian penalty can lower the critical ratio of inventory items, based on volume, to ensure that each store cannot order more than they can hold. A Python simulation was used to implement the critical ratio and spacial penalties. The simulation replicates the daily inventory environment of stores and counts overstocks and stock-out days. The simulation was checked by hand to ensure accuracy in replicating the actual inventory processes and then the old and new PAR values’ performance was compared in Excel. The team also created a second simulation that links a small and large store to study the effects on inventory pooling and store transfers.
Deliverables
The first deliverable is a modified Parbuilder Tool in Excel that includes new inputs to calculate the available volume a store has to hold non-refrigerated items, a capacity utilization table, and a macro function that generates the new PAR values. All Starbucks stores already use a version of this Parbuilder, so it would be easy for Starbucks to implement this deliverable as they already update the tool quarterly. The second deliverable is the code for the simulation so Starbucks can study the effects of the new Par Values and calculate them for other stores. The third deliverable is a Standard Operating Procedure document which has two sections to teach store managers and corporate analysts how to use the new Parbuilder tool. The final deliverable is the results from the inventory pooling study and the simulation code used so that Starbucks can make a decision if they would like to make inventory pooling a formal process.
Project Information
Student Team
Kate Beckwith, Leah Cills, Kevin Kane, Jarod LaFalce, Shivam Patel, Cole Puckett, Nikhil Reddy, Annie Robinson
Faculty Advisor

Faculty Evaluator