Poster
Client Context
Cox Communications is a leading provider of (1) video, (2) data, and (3) phone subscription services. They offer 49 different products across these three segments in nine regions (Arizona, California, Central Region, Florida/Georgia, Las Vegas, Louisiana, New England, Oklahoma, and Virginia). The Customer Retention Team at Cox Communications has determined that their analysis methodology to measure the effects of price changes on current customer attachment volume requires improvement. The current system is loosely defined, and analysis methods do not utilize the wealth of available historical data.
Project Objective
The objective of this project is to develop a modeling framework that determines the impact of price changes on current customer attachments to different products in Cox’s different market regions. This will enable Cox to find optimal product prices, standardize analytical methods, and ultimately make more effective decisions. This solution leverages historical customer data and trends in customer churn (service subscribers who discontinue their subscriptions).
Design Strategy
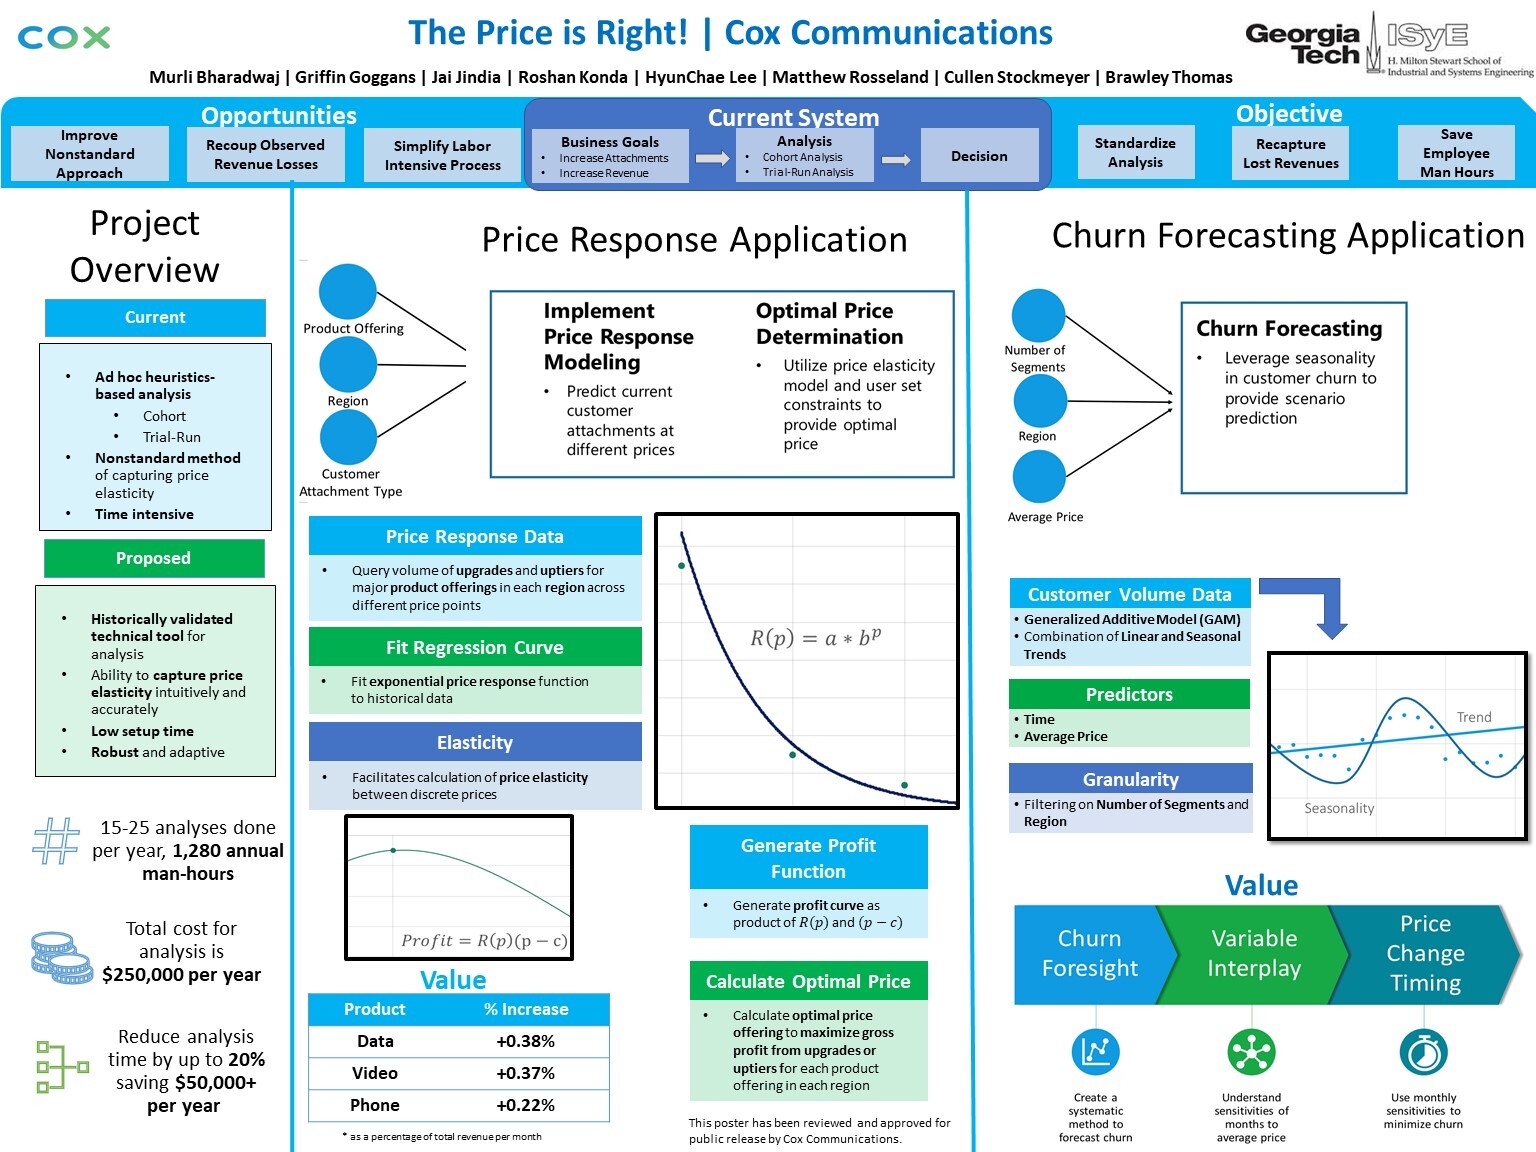
This project’s deliverables have been segmented into two stand-alone web-based applications for the customer retention team: (1) the Price Response Application, (2) the Churn Forecasting Application. The price response application is a dashboard where price elasticity modeling and optimal price determination can be conducted with an appropriate set of input parameters, and the churn forecasting application is a dashboard where churn can be forecasted with a set of input parameters (the number of product segments that any given customer is currently subscribed to, the region, along with a price array consisting of six allotted spaces; these spaces specify the prices that will be offered, on average, for each of the next 6 months). These applications are meant for analysts within the Customer Retention Team to conduct impact analysis. They have been preloaded with relevant historical data from 2019 in .csv data files.
The proposed solution includes:
1. Price elasticity modeling for current customer attachment
The method of improving the current nonstandard approach is based on the price response function, which establishes a statistical relationship between price offerings and current customer attachment volume on a product and regional basis. The price response function will allow the customer retention team to discretely calculate price elasticity of current customer attachment volume between any two given prices. To estimate this function, the average attachment volume across all price offerings (over the most recent 12-month time window) was calculated to ensure an adequately diverse representation of price and customer attachment volumes for a selection of products. Price actions only impact one price offering for products, and there is existing variability in the actual price customers pay. This means there is already data available for Cox to estimate the impact of changing price offering on current customer attachment volume.
To identify the most recent aggregate trends, customer attachment volume data at the different price offerings was queried manually and segmented by product, region, and customer attachment type. To simplify the deliverable, only the most popular products based on total current customer attachment volumes in the year 2019 were selected. Once the data was queried for each combination of product, region, and customer attachment type, it was aggregated to calculate the average customer attachment volume at each available price offering over 12 months of the most recently available data from 2019. Based on the law of demand, a consistent negative exponential relationship is observed between current customer attachment volume and price.
The exponential relationship is exploited by estimating the following function where a and b are the regression parameters.
Current Customer Upgrade Volume = a*b^(Price)
The model parameters are estimated by a Least Squared Regression approach, and the functional relationship between current customer attachment volume and price is determined. There are 198 total price response functions for each combination of product, region, and current customer attachment type.
To validate, we divided the historical data into a training and testing set. 2019 average customer data was reserved for the training set as it is the most recent full year of data that was unaffected by the COVID-19 pandemic. To test, we used data averaged from the first quarter of 2020 as this data was the most recent, and relatively unaffected by the pandemic. The Mean Absolute Error (MAE) was calculated for each of the 198 models. The MAE was low in the video and phone segments and higher in the data segments. This can possibly be attributed to data being a home necessity and having different competitive pressures.
2. Optimal price for maximizing profits from current customer attachments
The functional relationship between price and customer attachment volume which has been estimated using price response functions earlier can also facilitate the calculation of revenues and profits from each individual price offering. A profit curve can be constructed as the product of current customer attachment volume and the difference between price and marginal cost for each combination of product, region, and current customer attachment type. The maximum of this curve is the price at which profits from current customer attachments are the highest. This price is bounded by the marginal cost of providing the product and a maximum competitive price.
This profit curve is derived from the earlier determined price response functions and is constructed for each combination of product offering, region, and customer attachment type. Profit for each product in a specific region and customer attachment type is defined by the function below where a and b are the price response function parameters, Price is the monthly bill of the product, and Marginal Cost is the cost of providing the product to one additional customer.
Profit = (a*b^Price)(Price-Marginal Cost)
Marginal cost has been estimated as ½ of the rack rate of all products as instructed by the client, and maximum competitive price has been left as a user inputted data point in order to ensure the longevity of the deliverables. There are 198 total projected optimal prices for each combination of product, region, and current customer attachment type.
3. Aggregate churn forecasting
Due to seasonal and linear trends, customer churn is being modeled as a time-series forecast. Customers are aggregated based on how many segments they are subscribed to (e.g., 1 segment, 2 segments, 3 segment). Furthermore, customers are also aggregated based on the current market region. A time forecast model that takes in number of segments, region, and monthly average monthly bill is constructed and provides a 6-month prediction of customer churn volume.
The modeling technique chosen to forecast customer churn is the General Additive Model (GAM). This methodology allows us to separate the decreasing or increasing linear trend from the seasonal and non-linear trends and allow for inputs such as average monthly bill. Essentially the data is fit on a model that identifies the linear, seasonal trends and allows for an intercept factor as shown in the formula below.
Churn Volume = f_seasonal(Month) + f_linear(Month from Start) + f_non-linear(Average Monthly Bill) + Intercept
To validate the churn forecasting application, we used Mean Percent Error (MPE) for each of the forecasting models; 3 customer categories within 9 different regions led to 27 MPE values calculated. The average MPE was 6%, with a low at 3% and a high at 11%.
Deliverables
The solution is to be implemented through two deliverables:
1. Price response application
The price response application determines the price elasticity of a specific product in a specific region with respect to current customer attachments using regression techniques. Furthermore, this application recommends two prices to optimize profits from both current customer attachment types.
2. Churn forecasting application
The churn analysis application aggregates customer churn volume and uses time-series forecasting techniques to help analysts predict churn volume by segment and average price.
Both these applications are visualized in a dashboard using the Plotly Dash framework for Python.
Project Information
Student Team
Murli Bharadwaj, Griffin Goggans, Jai Jindia, Roshan Konda, Hyunchae Lee, Matthew Rosseland, Thomas Stockmeyer, Brawley Thomas
Faculty Advisor

Faculty Evaluator