Poster
Client Context
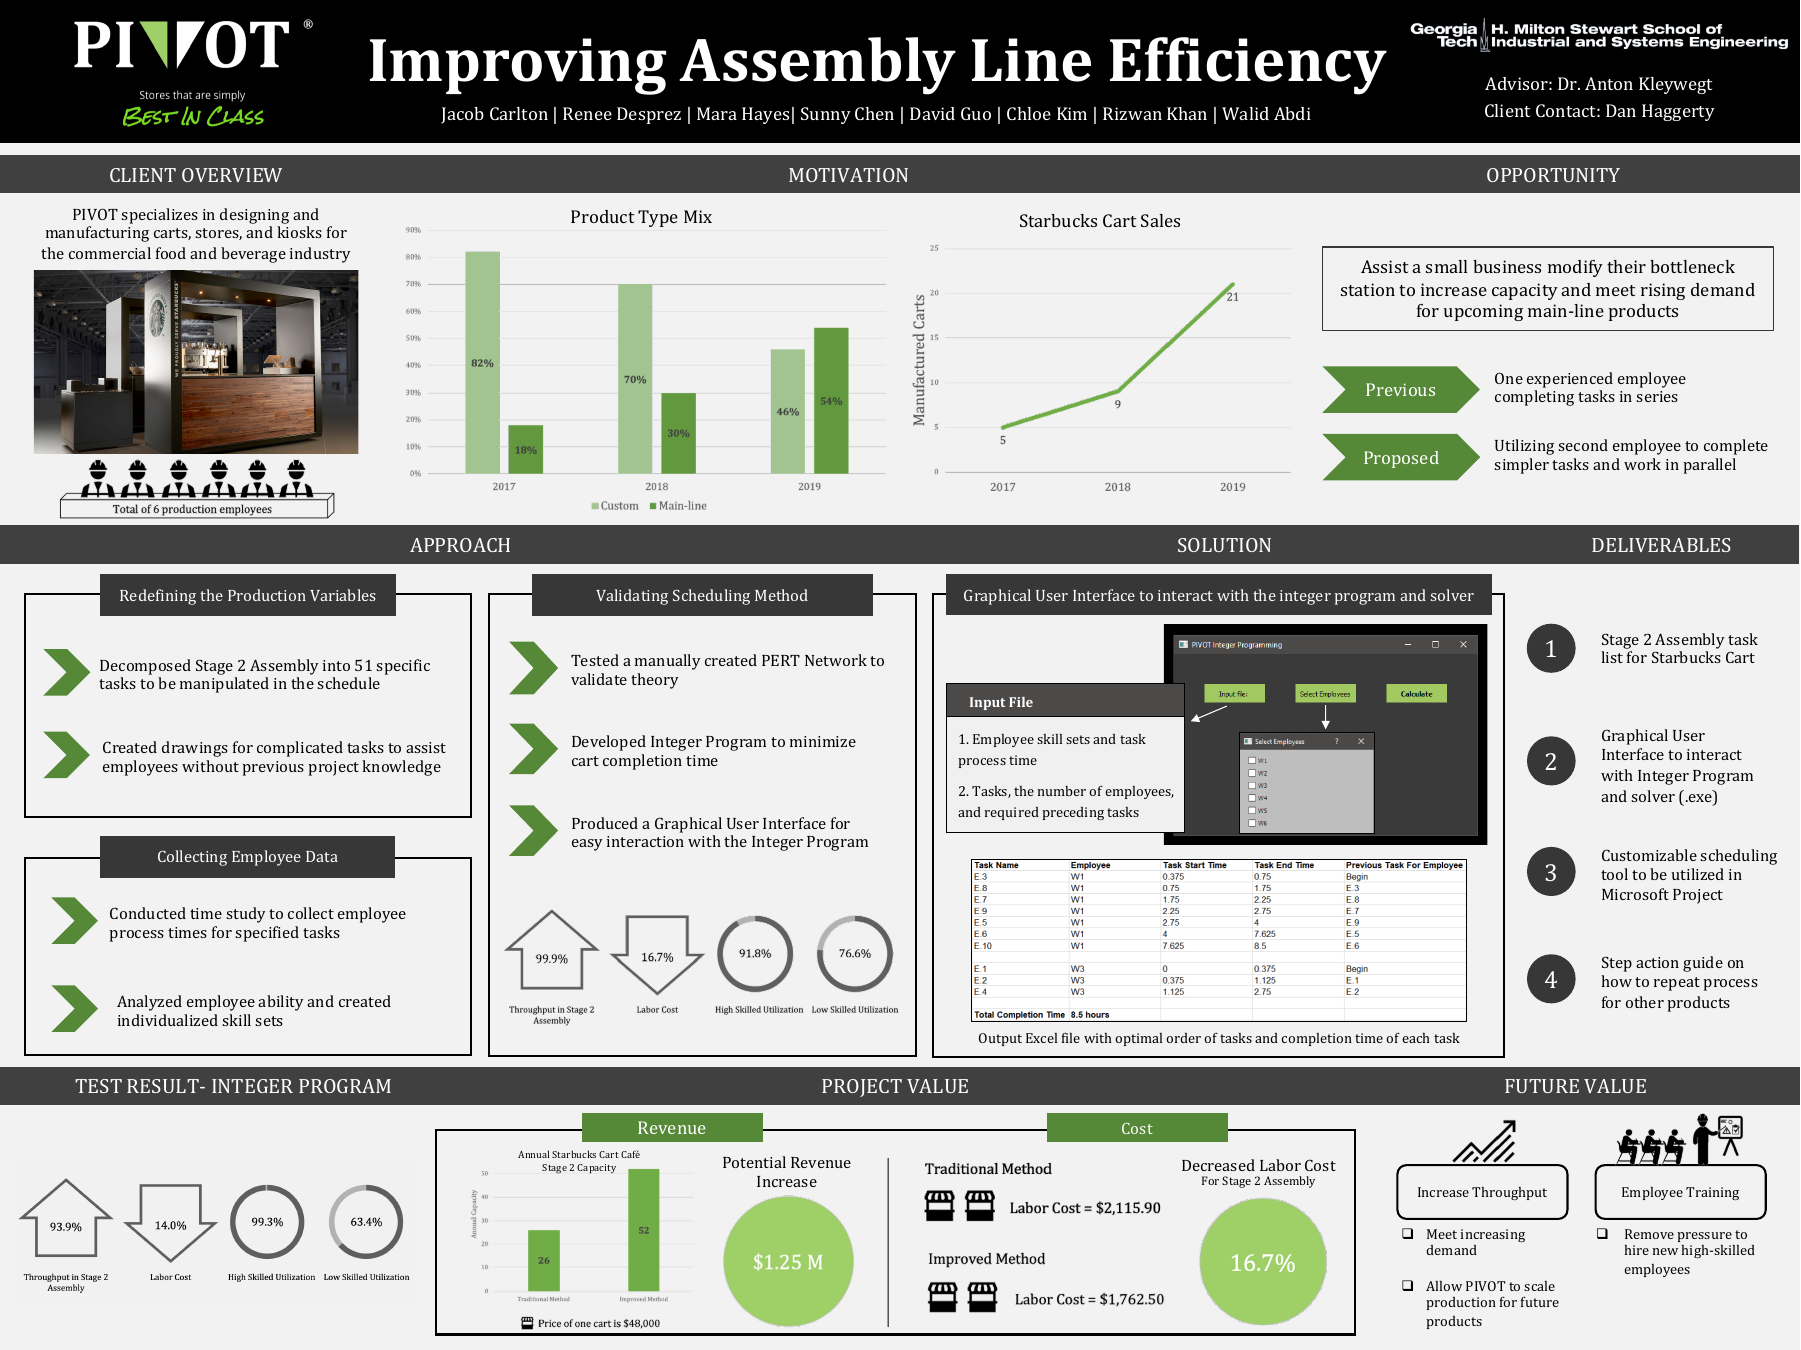
PIVOT is a small company located in Canton, GA that specializes in designing and manufacturing carts, stores, and kiosks for the commercial food and beverage industry. The company is currently in a growth phase, and in the past three years, the demand for its most popular products has increased by almost 75%. Since PIVOT employs just 6 production employees, PIVOT needs to improve the throughput of their production to keep up with the rising demand. There are two phases of production in PIVOT’s current production process. Phase 1 is highly automated whereas Phase 2 is more labor intensive. Phase 2 consists of Stage 1 and Stage 2 Assembly.
Project Objective
The team found Stage 2 Assembly to be the bottleneck station since tasks are completed in series and it takes twice as long to process a cart compared to Phase 1, which takes an average of 5 days. Due to PIVOT’s size and limiting resources, it will be difficult to hire more experienced employees. Therefore, PIVOT asked that the senior design team utilize its resources more effectively.
Design Strategy
Our solutions to improve the throughput of the bottleneck station consist of a PERT network, a customizable software, and a workers’ training manual. The PERT network, a graphical project management tool, will be used to determine the prerequisites of each task. This will allow PIVOT to schedule tasks in parallel instead of in series. The customizable software will output the optimal scheduling of tasks to lower the process time. The manual with a list of instructions on how to install/set-up utilities in Stage 2 Assembly has been given to PIVOT. The manual helps less experienced employees perform the simpler tasks while more experienced workers can work on the more complex tasks in Stage 2 Assembly allowing the workers to work in parallel. This solution was tested this semester when two carts passed through Stage 2 Assembley and the team tested a manual, initial schedule to validate that the parallel processing theroy would work.
Deliverables
For concrete data, we are providing the 51 specific tasks in Stage 2 Assembly for the Starbucks Cart Cafe and completion time data collected for them. This detailed task list with completion times allows PIVOT to use the scheduling tool provided to optimize their production schedule as well as have better insight into which specific tasks are taking the most time to complete. To assist with some of the more complex tasks, we have provided 9 CAD drawings which show how to assemble and install subcomponents of the Starbucks Cart Cafe. This will allow less experienced workers to be utilized more frequently in Stage 2 Assembly as they can follow these drawings when working on tasks that they otherwise would not be able to complete.
We are providing PIVOT with the scheduling tool that we used to calculate the Stage 2 Assembly production schedule for the Starbucks Cart Cafe. With this, PIVOT can recalculate the optimal schedule when current employees grow their skill sets, or with different employees entirely. PIVOT can also use this tool to calculate the optimal Stage 2 Assembly production schedule for products other than the Starbucks Cart Cafe. Additionally, we are providing a step action guide that the client can use for projects in the future. This outlines the steps taken this semester in the Starbucks Cart Cafe optimization and how to use the general scheduling tool.
Project Information
Student Team
Abdi, Walid
Carlton, Jacob
Chen, Sunny
Desprez, Renee
Guo, David
Hayes, Mara
Khan, Rizwan
Kim, Chloe
Faculty Advisor

Faculty Evaluator