Poster
Client Context
The client is a well-known professional golf club that hosts one of the sport’s most important annual tournaments. As part of running the event, the club’s leaders must choose daily pin placements for all 18 greens. These choices directly affect scoring difficulty, competitive balance, pace of play, and how engaging the tournament is for viewers. In the past, pin placement has been based mainly on expert judgment, tradition, and deep knowledge of the course.
Pin placement follows a structured system: each green has several approved hole locations, and every pin must meet expectations for fairness, challenge, and variety across the round. The tournament’s location also brings changing weather conditions that impact how specific pins play, especially when wind or moisture shifts from day to day.
The project aims to modernize this decision-making process. The team has studied the full system that links each pin choice to scoring patterns, leaderboard tightness, and the overall tournament experience. The client is looking for a data-driven framework that improves consistency and clarity in their decisions while still respecting tradition and maintaining the competitive character of the event.
Project Objective
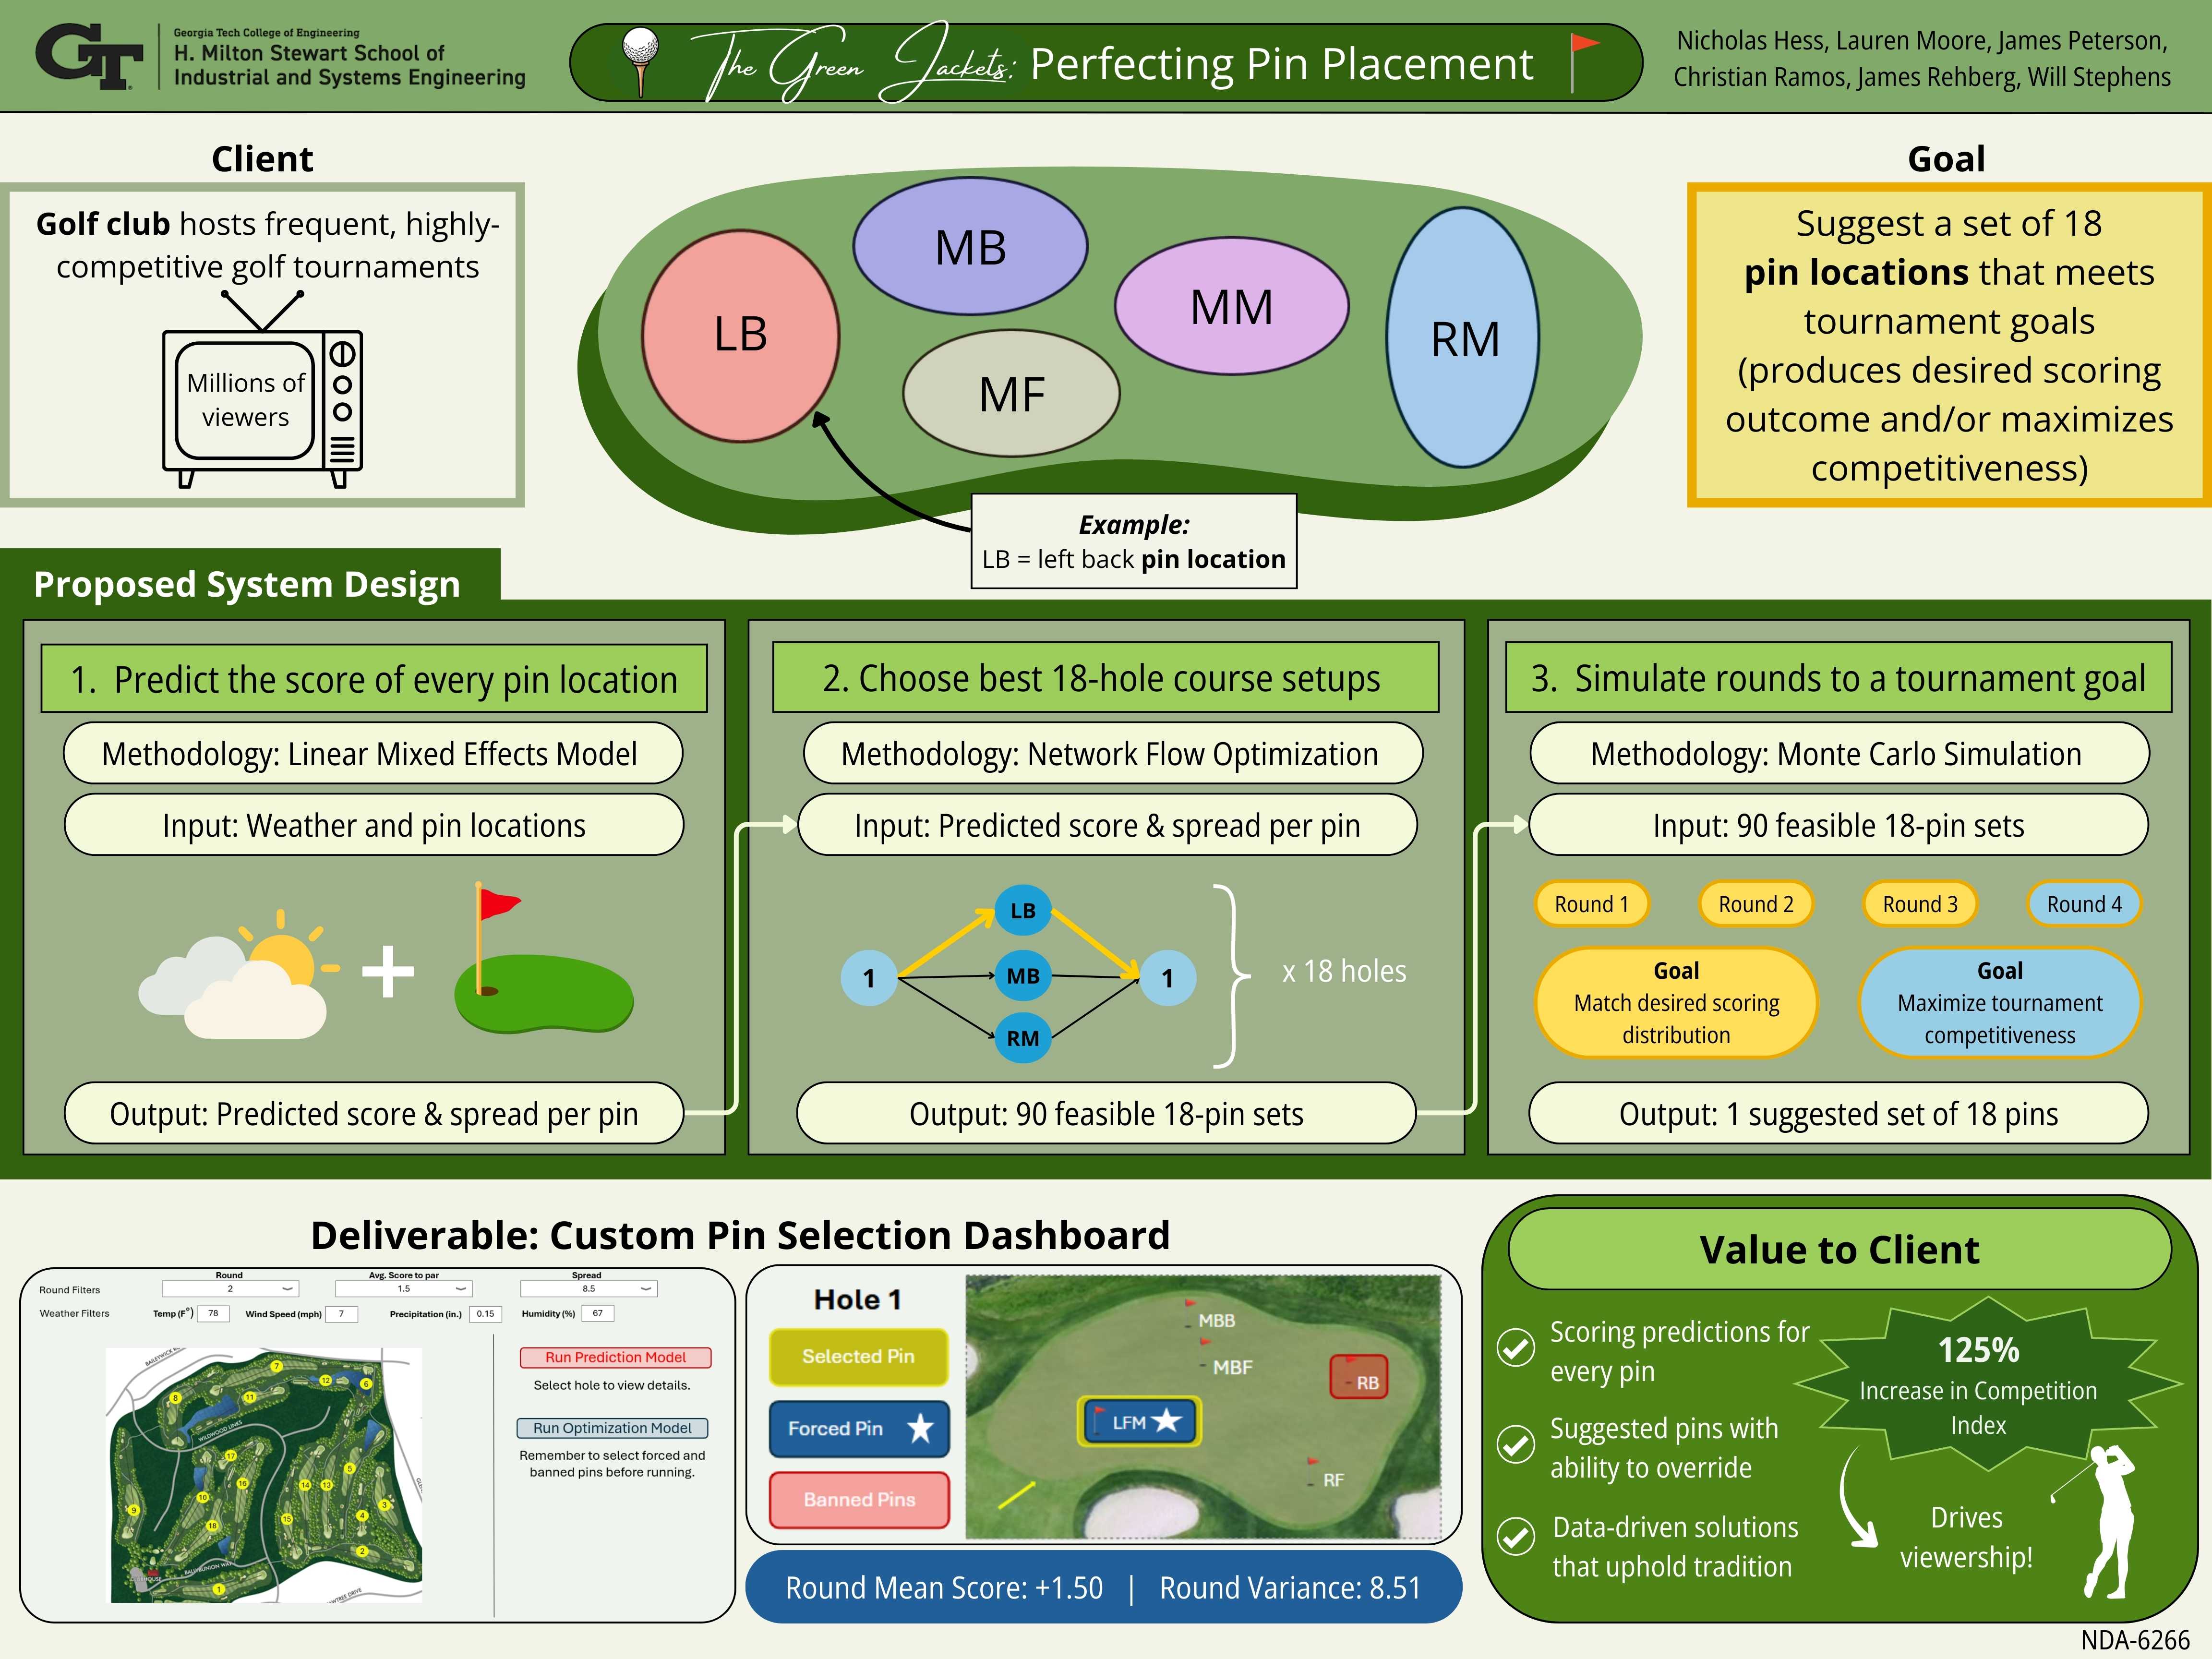
The goal of this project is to help the client make more informed and consistent daily pin-placement decisions for their tournament. While the current approach relies on expert judgement, it does not use the full value of the club’s historical scoring and weather data. This creates an opportunity to support the committee by providing them with a system that can show how each pin choice is expected to play and how different sets of pins may affect the round as a whole.
The final objective is to build a data-driven framework that connects pin locations to their predicted scoring outcomes, competitive balance, and overall tournament experience. By doing this, the project aims to give the client a clearer understanding of how certain decisions shape player performance and viewer engagement. This has been done by providing a tool that strengthens decision-making, respects long-standing traditions, and works to align pin placement with the club’s competitive and operational goals.
Design Strategy
Our team followed a structured system design process centered around modeling, experimentation, and validation. We began by defining the system to be redesigned and mapping its inputs, outputs, stakeholders, and constraints. Guided by ISyE methodologies, we collected and cleaned historical shot-level and weather data supplied by the client and conducted exploratory data analysis to quantify how scoring patterns changed across pin locations and climate conditions. Using these insights, we developed a predictive scoring model capable of estimating expected score-to-par and outcome variability for each hole-pin-tee configuration. This model incorporated regression and mixed-effects techniques to separate fixed weather effects from persistent pin-location effects. We then integrated these predictions into an optimization framework that recommends full-course pin sets while satisfying operational constraints such as fairness, hole-variety rules, and target course difficulty.
Our validation relied on a rigorous leave-one-year-out cross-validation across all eleven years of Masters data. We would hold out one tournament year, fit the linear mixed-effects model on the remaining ten years, and evaluated predictions on the excluded year to ensure true out-of-sample testing. The model achieved a mean-score MAE of 0.0972 strokes- smaller than the typical within-in standard deviation of roughly 0.125 strokes- and a variance-prediction MAE of 0.0962, which is below the natural year-to-yar variability of empirical variances (about 0.105 strokes). In both cases, predictive error falls well below the underlying noise in the scoring process, demonstrating that the model captures stable, repeatable patterns rather than overfitting historical fluctuations and is sufficiently accurate for use in downstream optimization and decision-support.
Deliverables
Our final deliverables include: (1) a predictive scoring model that quantifies expected mean and variance for every hole-pin-tee configuration under tomorrow’s weather, giving the committee a data-grounded understanding of how each location is likely to play; (2) a pin set screening tool that constructs full 18-hole pin sets satisfying setup constraints while targeting a desired level of course difficulty (measured by mean expected score) and round-to-round competitiveness; (3) a simulation engine that evaluates predicted scoring distributions for any candidate slate, supporting comparison of alternatives and enabling “what-if” setup scenario testing and (4) an interactive dashboard that integrates all model components into a single, easy-to-use interface for daily decision-making. Together, these deliverables supplement the current intuition-driven pin-selection process with a transparent, and data-backed system, allowing the client to anticipate scoring outcomes, manage unpredictability, and intentionally shape the competitiveness and viewer engagement of the tournament.
Value and Impact
This project delivers meaningful value by giving the client a reliable and transparent system for making daily pin-placement decisions which are one of the most influential elements of tournament setup. By combining predictive modeling, pin set screening, and simulation in a single framework, the system helps our client understand how each pin choice will affect scoring, competitiveness, and the overall experience for players and viewers. This leads to more consistent decision-making and a clearer connection between course setup goals and expected outcomes.
As far as concrete value is concerned, a more competitive tournament will help lead to an increase in viewership, which is our client’s goal. To do this, we worked with our client to develop a competitive index that measures the closeness of the field of golfers, which can then be tied to the 18 pin setup for the day. When running the least competitive years through the model with the same conditions and inputs, the 18 suggested pins in the output predicted a predicted competition index increase of 125% in 2015 and 25% in 2024. Thus, our machinery can improve the competitiveness of the tournaments, which helps increase the viewership.
Beyond the analytical improvements, the project strengthens the traditions that make this tournament one of the most respected events in all of sports. Pin placement has always played a key role in shaping the identity of each year’s tournament, its competitive drama, and the memorable moments fans associate with the course. This system supports these long-standing values by giving decision-makers better tools, not by replacing their judgment, but by enhancing it. The created dashboard allows the committee to explore options, compare alternatives, and confirm that each round will deliver the fairness, excitement, and strategic depth that the event is known for.
The impact of this project extends beyond operational efficiency. It helps preserve the quality, integrity, and “magic” of a tournament that is defined by its traditions as much as it is by its competition.
Project Information
Student Team
- Nicholas Hess
- Lauren Moore
- James Peterson
- Christian Ramos
- James Rehberg
- Will Stephens
Faculty Advisor

Faculty Evaluator