Poster
Client Context
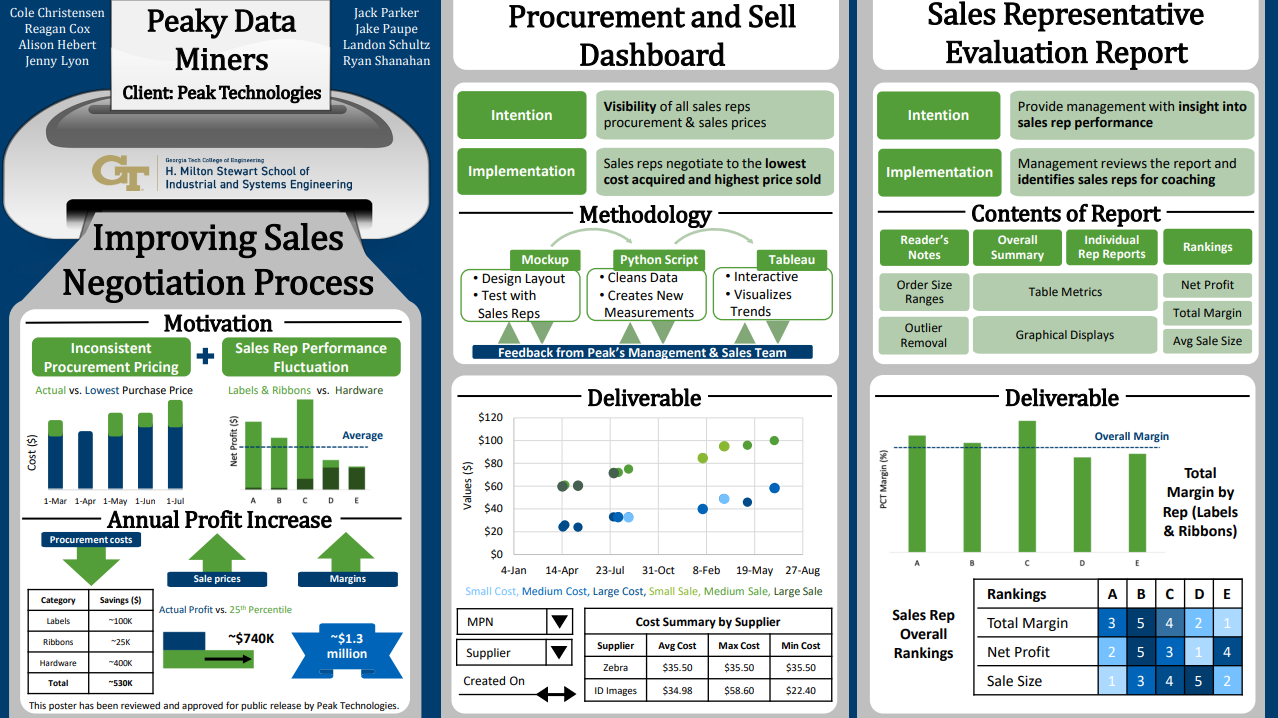
Peak Technologies is a major supply chain, retail, and mobile solutions provider. A portion of Peak’s business is the distribution of labels, thermal ribbons, and hardware used for warehouse operations.
Peak has a sales team that has the task of communicating with customers and determining what product will appropriately satisfy the customer’s needs. After deciding what product(s) the customer requires, the sales representative communicates to a manufacturer to purchase the product which is then transported to the customer’s warehouse.
Project Objective
Peak tasked the team with finding areas of improvement within the order fulfillment process, particularly the sales and procurement portion. They provided order history data and access to sales representatives so the team could fully understand the process and identify opportunities in product demand, pricing negotiation, or other areas.
Design Strategy
Through interviewing the sales representatives, the team found that there was a nonstandard process in attaining prices for both procurement and sales. This resulted in price variance for specific product purchased. To give Peak the ability to avoid buying product above market price and selling below ideal price, the team focused on two strategies. First, the team investigated what was resulting in the representatives acquiring lower than ideal prices for their product. The team found that giving sales representatives visibility on other representative’s transactions would improve margins. Second, the team investigated how management may improve their ability to measure representative performance. The team created two deliverables discussed below, one which improves representative performance directly and the other which improves managements ability to coach representative performance.
Deliverables
The first deliverable the team created was the Procurement and Sales Dashboard, which went through many iterations based on feedback from Peak. The dashboard is intended to be connected to live historical data so sales representatives can see on a graph exactly what prices certain products have been procured or sold from which supplier and can even specify looking at a specific customer. The graph can be adjusted to look at only a specific time frame and the dashboard also shows a summary table for the maximum, minimum, and average procurement and sale prices achieved.
The sales representative evaluation report is a compilation of new evaluation metrics & visualizations summarizing sales representative historical performance. The intention behind the report is to provide management with greater insight into individual sales representative performances so they can review it and identify representatives in need of coaching to reach their goals and potential. The sales representative evaluation report is made up of 4 different parts, each split into Labels & Ribbons, which are grouped together because they are both printer consumables, and Hardware. The first section is the reader’s notes, which goes over how the order sizes are determined and what the range is for each size. It also includes information about how we removed the outliers from the data. The second part is the overall summary, which is comprised of a table with metrics about sales, purchases, margins, and more calculated across all sales representatives. The summary also visualizes many of these metrics some of them showing each sales representative’s performance side by side and others are summed or averaged across all sales representatives. The team also felt it was important to show the rankings of each sales representative for net profit, total margin, and the average sale size so that management will be able to easily compare the sales representatives in each category without flipping pages and keeping track of each person’s performance. The last section in this report shows the same metrics and visualizations as contained in the overall summary, but instead on the individual level. Also included in the report is a how-to-guide which details how each of the metrics and visualizations were calculated and created.
Value and Impact
With the implementation of the procurement and sales dashboard as well as the sales representative evaluation, an estimated ~$530K is expected to be saved on annual procurement costs. This was determined by looking at order history and understanding what % of procurement cost was overspent on product purchased above market price. Another ~$740K in profit improvement is expected to be gained through improved sales prices. This will amount to a total annual profit improvement of ~$1.3 million.
Project Information
Student Team
- Jenny Lyon
- Reagan Cox
- Ryan Shanahan
- Alison Hebert
- Cole Christensen
- Jack Parker
- Landon Schultz
Faculty Advisor

Faculty Evaluator