Poster
Client Context
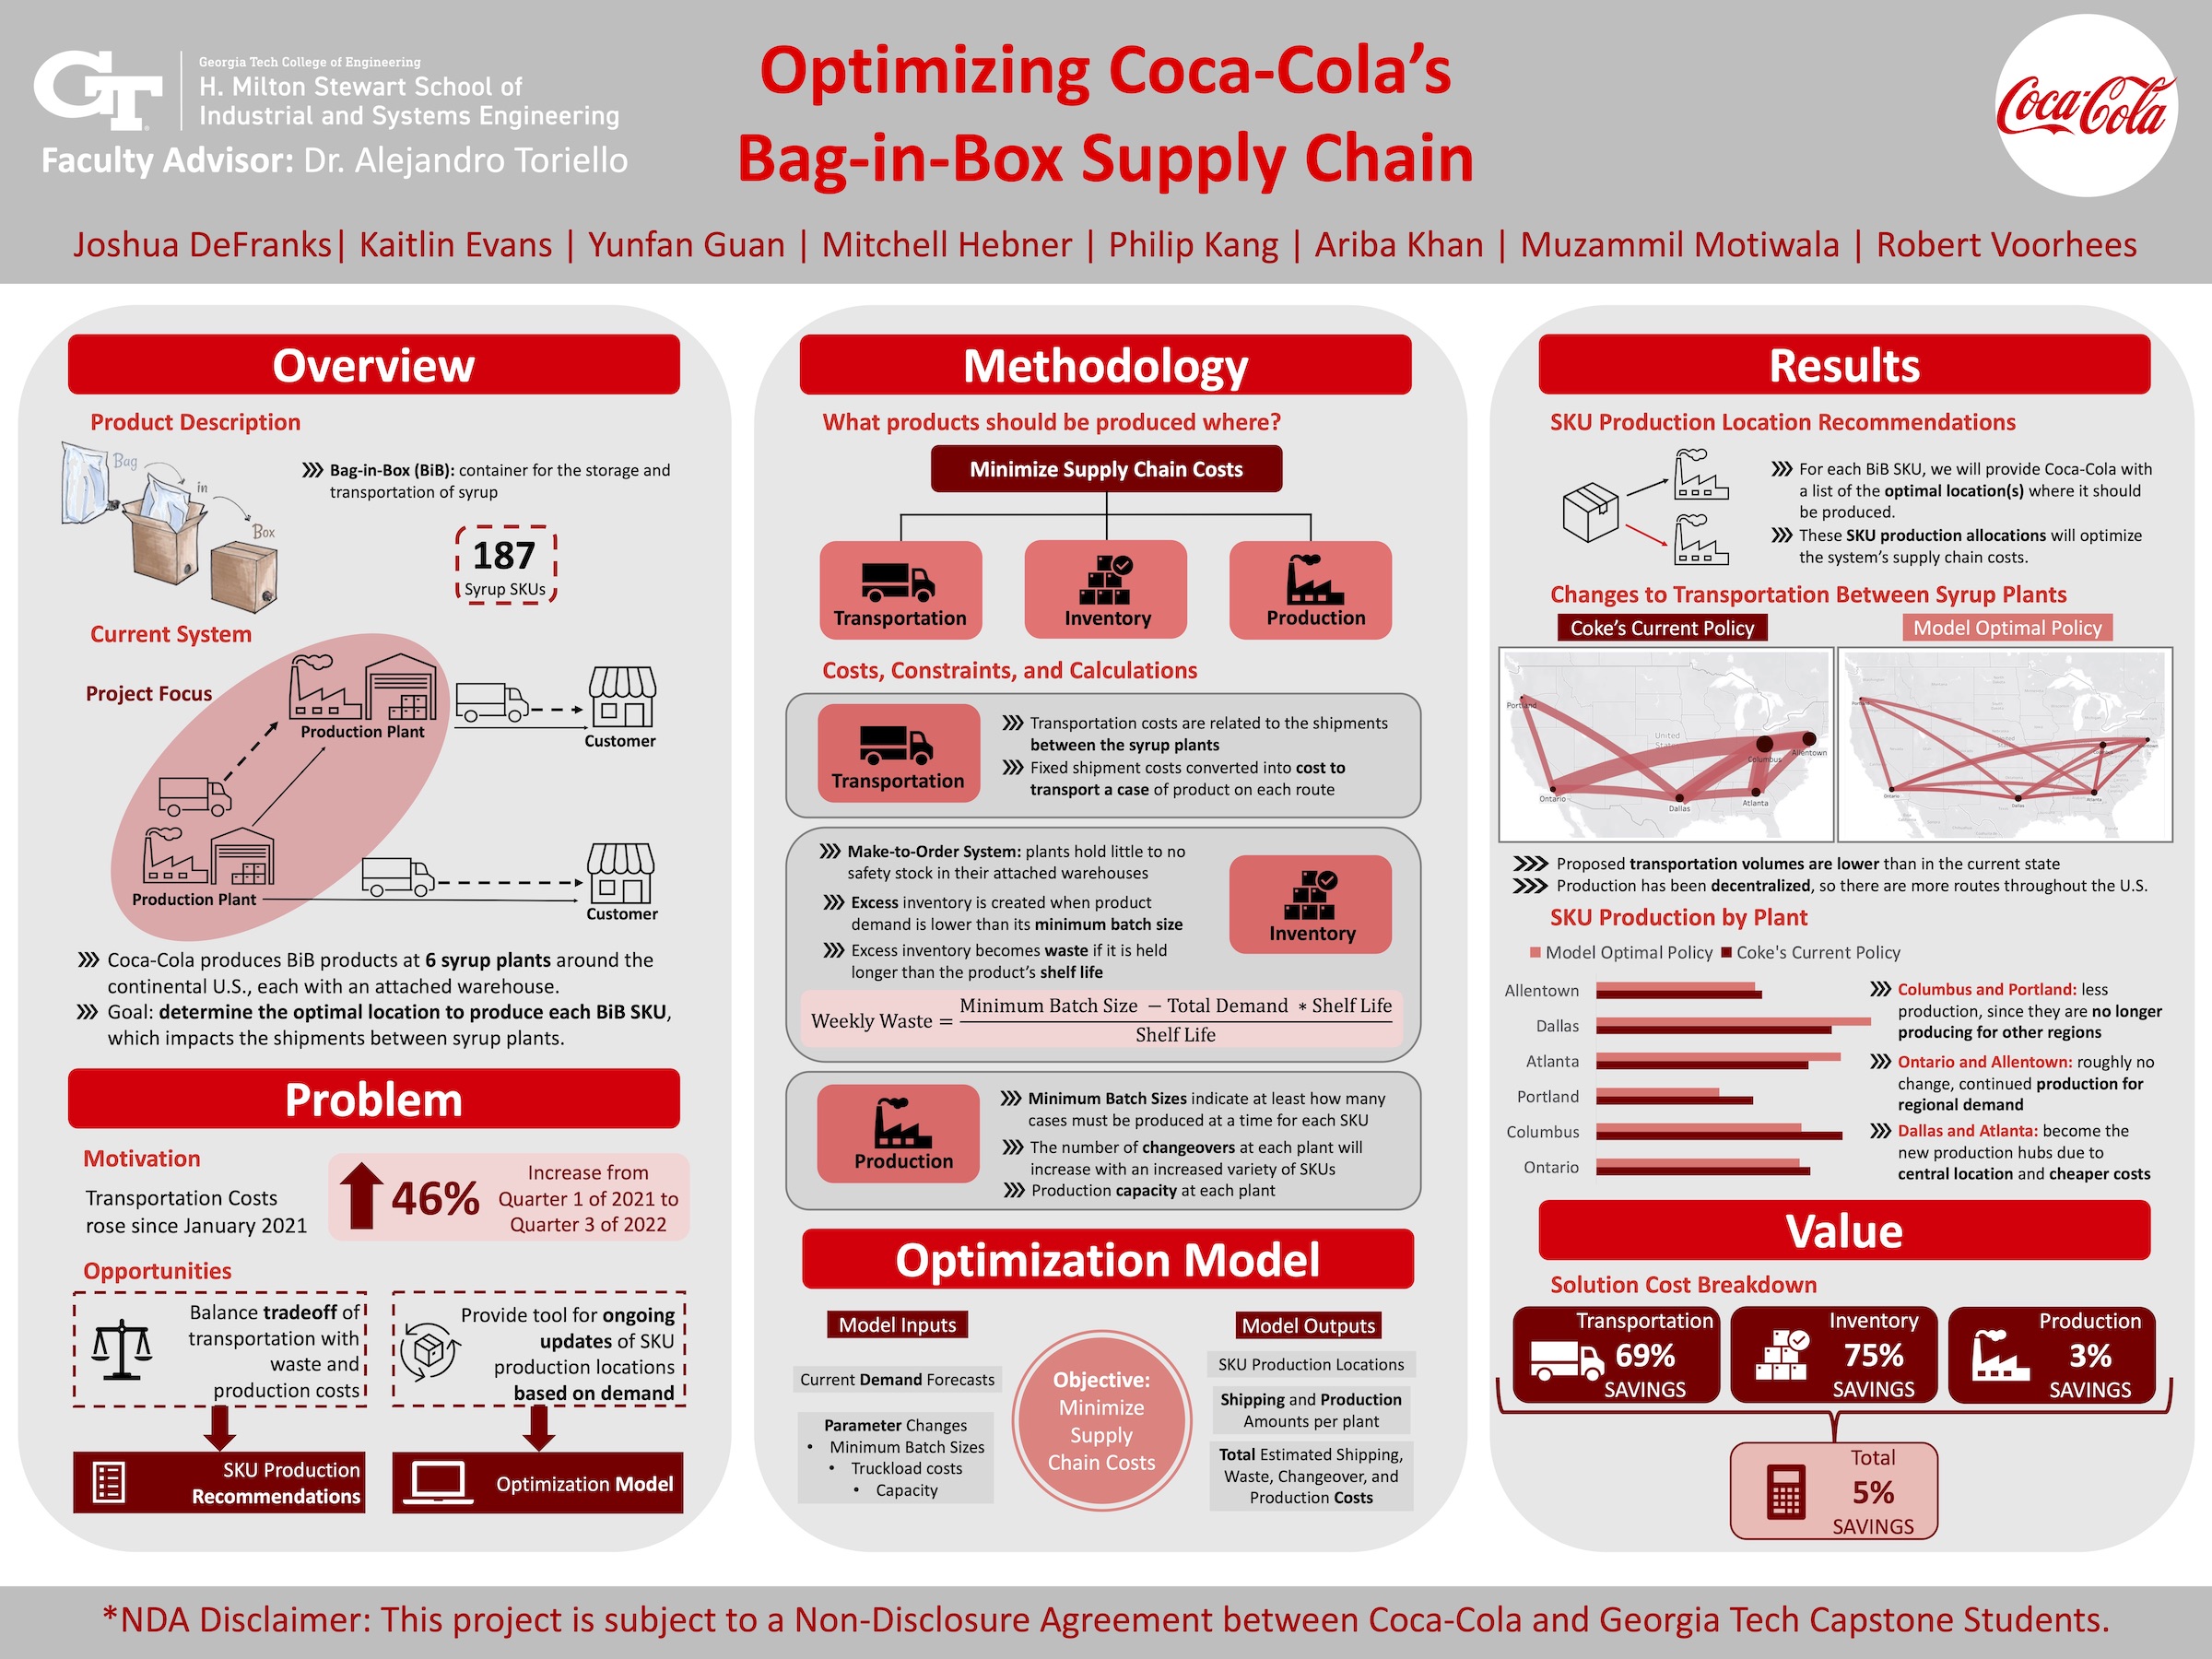
The Coca-Cola Company is a Fortune 100 beverage company with over 320 million consumers and approximately $228 billion industry value in North America alone. The team was given the opportunity to work with Coca-Cola’s North American end-to-end planning team on this project, whose role is to determine the demand and supply planning for the North American operations. Within North American operations, the Foodservice segment handles products that are sold to companies in the foodservice industry, and one of these product types are Bag-in-Box (BiB) products.
A BiB is a bag full of syrup that is encased in a sturdy cardboard box. It is screwed into soda fountains and connected to hoses that mix soda water with the syrup to create the soda commonly used at restaurants and bars.
Project Objective
The goal of this project is to determine the optimal location to produce each BiB SKU to minimize overall supply chain costs, which include transportation, production, and inventory costs. Since the customers in each region are always served by the same facility, this project will only impact the inter-site transportation of BiB products. Decisions regarding shipments from the final facility to customers are not in the scope of this project.
The motivation for this project stems from the increase in Coca-Cola’s overall monthly transportation costs for outgoing shipments from the six syrup plants since 2021, as shown in figure 4. These costs include both the inter-site transportation costs and the transportation to customers for all BiB products. Due to the pandemic and staffing shortages, Coca-Cola has not reviewed the production distribution decision since was put in place a few years ago, and this project will provide an opportunity to analyze the costs related to this system as well as provide a framework for future decisions.
Design Strategy
In this transportation network, the demand in each region for each SKU is sourced by a single plant. This may be the plant in that region, in which case there is no inter-site transportation, or the plant in that region may receive shipments from another plant. There are no instances where regional demand for one SKU is fulfilled by multiple syrup plants.
Regardless of where each SKU is produced, all regional demand throughout the country must be fulfilled. Coca-Cola requested the team use their historical shipment data from 2021 as a template for demand that needs to be met to serve each customer. The team performed an analysis that accounted for the variability in the demand and smoothed the data to determine the average demand per week. The demand data showed a seasonal trend, and the team identified that in general, demand is lower during the winter months and higher during the summer months. For this reason, the team did an additional analysis to determine the average weekly demand during a high, medium, and low season.
The team incorporated the transportation, waste, and production costs into a Mixed Integer Program to determine the optimal production locations for each SKU. The objective function of this model is to minimize the three categories of costs.
Deliverables
The first deliverable for this project is a list of the optimal SKU production location recommendations, which is the main output of the model and fulfills Coca-Cola’s short-term need of optimizing the current state. The model factors in the waste and production costs as tradeoffs to the transportation costs, which then makes a holistic decision for each SKU. The demand data was identified to be variable and follow a seasonal trend. After plugging the seasonal demand data into the model, the team found that the recommendations to Coca-Cola are fundamentally the same for the high, average, and low demand seasons, so the recommendation list was chosen based on the average demand season.
Value and Impact
The team’s recommendations for the optimal SKU production locations lead to direct savings of Coca-Cola’s supply chain costs. In the current system, production costs account for 97% of the total costs, whereas waste accounts for 2% and transportation accounts for 1%. The team analyzed these results and determined that a large portion of the production costs can be considered unavoidable costs. This is because there is an associated cost of producing each SKU, regardless of changeovers, and regardless of fluctuations in the production costs across facilities. The team calculated the total production costs to fulfill an average week’s demand if it was always produced at the cheapest location. These unavoidable costs account for 85% of the total production costs. To analyze the savings of the avoidable costs, the team removed the unavoidable costs from the system and performed the same cost comparison. In this case, production costs account for 86% of the total costs, whereas waste accounts for 10% and transportation accounts for 4%. This analysis shows that the team’s model optimized this system and saved 26% of Coca-Cola’s avoidable 9 costs for BiB products.
Project Information
Student Team
Joshua DeFranks, Kaitlin Evans, Yunfan Guan, Mitchell Hebner, Philip Kang, Ariba Khan, Muzammil Motiwala, Robert Voorhees
Faculty Advisor

Faculty Evaluator