Poster
Client Context
Mix Tape Ventures (MTV) manages a portfolio of private companies centered around manufacturing commercial refrigeration equipment as well as several e-commerce brands. The company has seen a 15% growth in revenue across its platforms and plans to maintain this average for the upcoming years. As a result of this growth, MTV has encountered challenges with inventory management, facility layout and waste in its gasket manufacturing process.
Mix Tape Ventures focuses on the following main product lines; commercial refrigeration gaskets and hardware, custom cutting boards, and to a lesser extent home decor items. Gasket manufacturing accounts for roughly 75% of their revenue. There are two facilities, the GU (Gaskets Unlimited) facility and the TO (Tech Oasis) facility. They are 3.5 miles away from each other and both manufacture and store gaskets. The commercial refrigeration parts or hardware are sold across multiple platforms and there have been several problems with the current inventory tracking and managing the inventory they currently have. The company is in need of a software that has the capability to manage their system, especially given their goals for expansion.
Project Objective
Inventory Management:
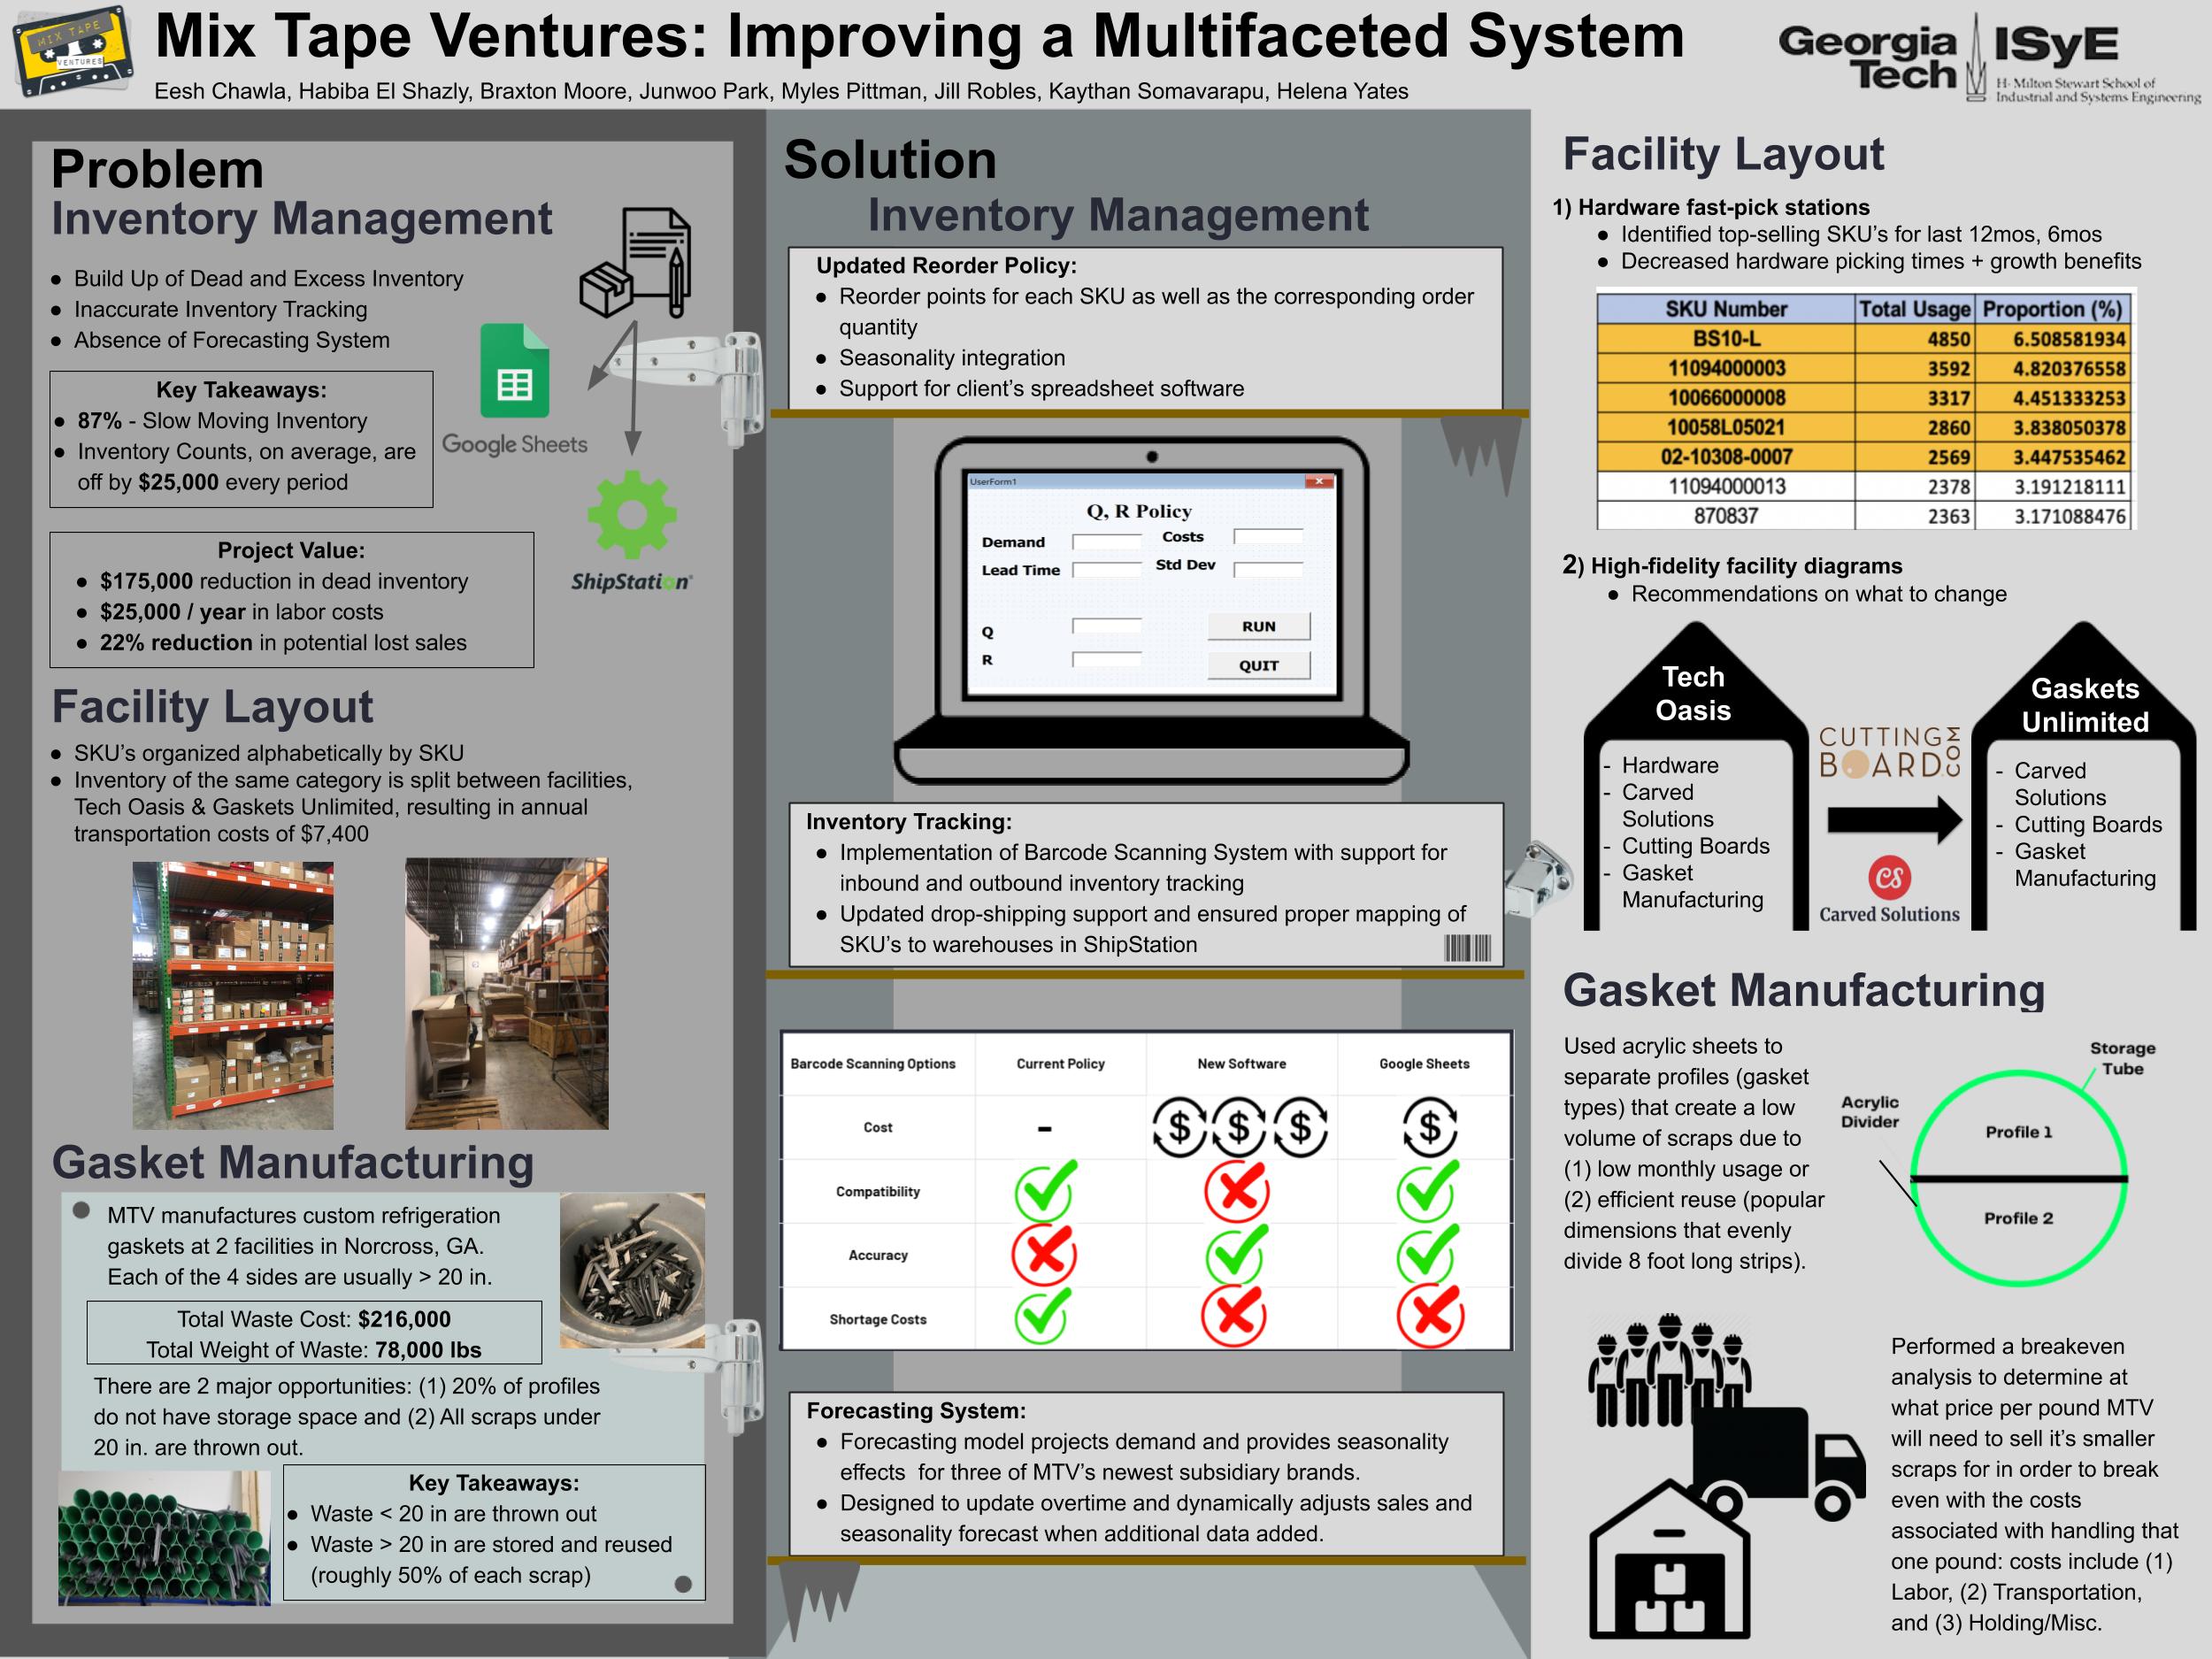
Reordering Policy for Hardware Inventory: The current reorder policy is based on a moving average of demand over ten periods, called average usage by MTV (one period is two weeks). When the periods of inventory (POI) dip below a predefined threshold of 3.5, MTV orders more. The POI of 3.5 was determined through a trial and error methodology, where the goal is to never be out of stock when a customer orders. Currently, more than 50% of hardware parts have a POI greater than 3.5. This static reorder policy leads to a build-up of inventory over time. Approximately 87% of inventory can be categorized as slow-movers, which were determined to have an average usage of less than 10 items per period. Lastly, 23% of the SKUs accommodated for 80% of the annual demand.
Inventory Tracking: ShipStation - the inventory tracking software - has given MTV inaccurate hardware inventory counts. These discrepancies require MTV to conduct bi-monthly manual counts to the inventory levels. The average magnitude of the discrepancy through the last seven periods was $24,971.28, which accounts for 5% of the total value of hardware inventory. A Pareto analysis showed that 80% of the overall SKU discrepancy is due to 18% of the SKUs, which is closely aligned with the fast movers. This presents an opportunity to assess the process flows involved with MTV’s current fulfillment process and to introduce automation and other operating procedures that would improve the overall efficiency of the system.
Demand Forecasting: Seasonality has a strong effect on sales in MTV’s products. However, no system is currently in place to quantify its effect or to make future demand forecasts based on past sales data collected. This presents an opportunity to create an adaptable forecasting system for MTV that utilizes past sales data to assess seasonality and to project demand.
Facility Layout
Facility Layout: Currently, there is cutting board and carved solutions inventory being stored at both facilities although most of the production is at the GU facility. Further, some products such as cutting boards are stored in alphabetical order rather than by pick frequency. Therefore, our two main opportunities are: (1) Reducing unnecessary transportation of inventory between both facilities and (2) Reorganizing products such as cutting boards to allow MTV to easily pick popular items.
Manufacturing
Gasket Manufacturing: The goal of the gasket manufacturing section of the project was to reduce costs associated with gasket waste. Gasket waste can be broken down into two categories: large scraps (>20 in.) and small scraps (20 in.). Large scraps are temporarily stored in a scrap storage system, which is essentially a group of hollow tubes with each tube being assigned a type of gasket (or profile). Large scraps of profiles in these tubes are reused for future orders. As MTV continues to acquire new types of gaskets, there is an increase in gasket waste from production due to insufficient storage allocations for these new profiles. Additionally, there is a large amount of small unusable scrap material that is thrown away rather than being salvaged or recycled.
Design Strategy
Inventory Management:
Reordering Policy
The primary need for a new reorder policy is exemplified by the high amounts of slow-moving inventory that MTV holds. Accounting for lead times and safety stock also allows MTV to develop a more sustainable approach for inventory management. The firm faced the following properties when it came to ordering and fulfilling customer orders: stochastic demand, positive lead times, fixed ordering cost, fixed order interval, and the allowance for shortages. Given these following properties, it was most appropriate to utilize a Q,R Policy. The Q,R Policy was compared to the current system that was in place and with the adoption of the proposed solution MTV could reduce capital locked in as inventory by $105,000, while fulfilling the same amount of orders.
Inventory Tracking
The approach for solving the SKU discrepancy problem was two-fold, first to look at the process flows involved and second to look at the tracking software called ShipStation itself. Research was conducted on why inventory tracking counts are off and estimates by industry experts state that 60% of the time it is due to human error. The approach for reducing the human error component was to introduce automation to the process flows, by adopting a barcode scanner to properly account for all incoming SKUs from suppliers. The second part was to examine ShipStation to ensure that all selling channels and properties assigned to each part were correct in order for the right deduction of inventory to take place when an order needs to be shipped out.
Demand Forecasting
The first step involved in creating the forecasting system was to pull the data from ShipStation to gain the total itemized sales information. Additionally, data cleaning procedures were applied to group the data into quarters that aligned with the financial periods that MTV follows. The correct forecasting methodology was based on the overall seasonality each firm faced as well as the overall increased growth in demand over time. The adoption of a Multiplicative Holt Winters Model was utilized as it was the most accurate model when comparing the Mean Absolute Percentage Error (MAPE) across all suitable alternatives.
Facility Layout
Facility Layout:
The facility layout consisted of two categories; fast picking station and an annotated high fidelity schematic of MTV’s warehouse operations. For the fast picking station, the sales data was evaluated for hardware parts for the last year and last six months to ensure stability of the most popular items. Once these items were identified, they were categorized as SKUs that should be transferred to a fast picking station. Furthermore, data collection for observing packaging and picking times were recorded in order to obtain a baseline estimate of total time taken within the warehouse for order fulfillment. The fast picking station performance was compared to the original system and the analysis shows that there would be a reduction in total time within the system for the popular hardware SKUs. For the layout diagram, multiple site visits occurred in order to obtain accurate measurements of the warehouse dimensions as well as the allotted spaces for varying operations that are housed in both facilities. Once these were obtained, annotations were added to leverage economies of scale through consolidation of similar products, as well as reducing transportation costs and picking times.
Manufacturing
Gasket Manufacturing:
The strategy for gasket manufacturing was to break the problem down into two parts: (1) Creating space for new profiles in the existing scrap storage systems and (2) Creating a break even formula for recycling smaller scraps. To create space for new profiles, the solution was to use acrylic sheets to separate the tubes to fit profiles that take up less space. The team first collected monthly usage and scrap production data at each scrap storage system and created a list of profiles that produced a small volume of scraps. This profile list was then validated by the facility managers at both facilities and then used to determine which profiles to split in each tube. To create a break even formula for smaller scraps, the first step was to research the market price of PVC material as well as minimum pickup volumes from recycling companies. Then labor and transportation costs associated with handling a certain volume of waste were calculated and placed into the formula. Through this analysis, MTV will be able to determine if future quotes from recycling companies are worth it by plugging in the appropriate variables into the formula. Due to uncertainty in pickup location and dropoff distance, the cost numbers should only be used as estimates and not as final numbers.
Deliverables
There are 7 deliverables in total:
Reordering Policy for Hardware Inventory: The deliverable for the reorder policy will be in the form of an Excel Macro that is compatible with their Google Sheets. The macro has two buttons, which represents the optimal order quantity and the reorder policy, and MTV will only need to click those buttons to get the (Q,R) values for each of the SKUs. These values can then be copied over to the Google Sheets, so that every employee has access to the reordering policy. The macro can be updated daily by clicking the aforementioned buttons, and can be continuously copied over to the Google Sheets, depending on their updating schedule. The value of a fixed cost will be based on user input rather than a predefined value. Lastly, the regression model created to determine the fixed ordering cost will be delivered, so that as more ordering cost data comes in the accuracy of the fixed ordering cost improves over time.
Inventory Tracking: With the adoption of a barcode scanning system, cost estimates were obtained from fifteen firms and were presented. The decision was made to use an application that is found on smartphones that scans barcodes and directly places the counts to their Google Sheets. This was due to the application being easy to use, the overall compatibility with their software, and the costs associated with the scanning system. A standard operating procedure on how to create barcodes as well as correctly input parts into the Google Sheets will be provided to facilitate the implementation. After looking through ShipStation it was noted that the hardware parts were not associated with a warehouse. This led to each of the parts starting with a baseline stock level of zero rather than what is actually the case in the warehouse. Assigning the hardware parts to the correct warehouse would allow for the stock level to start from a correct initial count and would help with tracking inventory accurately.
Demand Forecasting System: The sales forecasting tool, like the (Q,R) Policy, is built within an Excel spreadsheet to fit within the technical framework of MTV. Statistical KPIs, future forecasts, and key areas that need updating within the table are color coded and a detailed standard operating procedure document has been created to outline how to update the model and interpret these KPIs.
Hardware Fast-Pick Stations: A hardware fast-picking station is a designated set of accessible racks where the top 5 fastest picking items will be grouped together to facilitate faster picking. These racks would be replenished from original racks as needed. Since the top 5 SKUs account for almost a quarter of total hardware usage, the content of the fast picking stations is relatively stable. The hardware fast-pick station will reduce average picking times and the process will not entail increased employee training costs since the original organization of products on shelves remains unchanged.
Facility Layout Diagrams and Recommendations: The created facility layout diagrams for TO and GU ensure a smooth flow of work, material, and information through the system. The diagrams also help analyze and assess changes in MTV’s inventory organization.
Scrap Storage Solution: The SOP document for the scrap storage solution will include: (1) Problem Statement and Value, (2) Summary of Analysis, (3) Prerequisites for Implementation (Required Materials), (4) Steps for Implementation, and (5) Next Steps (For future profile acquisitions). An excel sheet with a detailed layout of the final storage allocations will also be provided, along with explanations of the analysis.
Break Even Analysis for Scrap Salvage: The research on salvage potential for gasket waste will be delivered in the form of a document which will consist of the following items: (1) Overview of Scrap Material Findings - Key Takeaways, (2) Annotated list of companies contacted, (3) Break Even Analysis, and (4) Next Steps.
Project Information
Student Team
Eesh Chawla, Habiba Elshazly, Braxton Moore, Junwoo Park, Myles Pittman, Jill Robles, Kaythan Somavarapu, Helena Yates
Faculty Advisor

Faculty Evaluator