Poster
Client Context
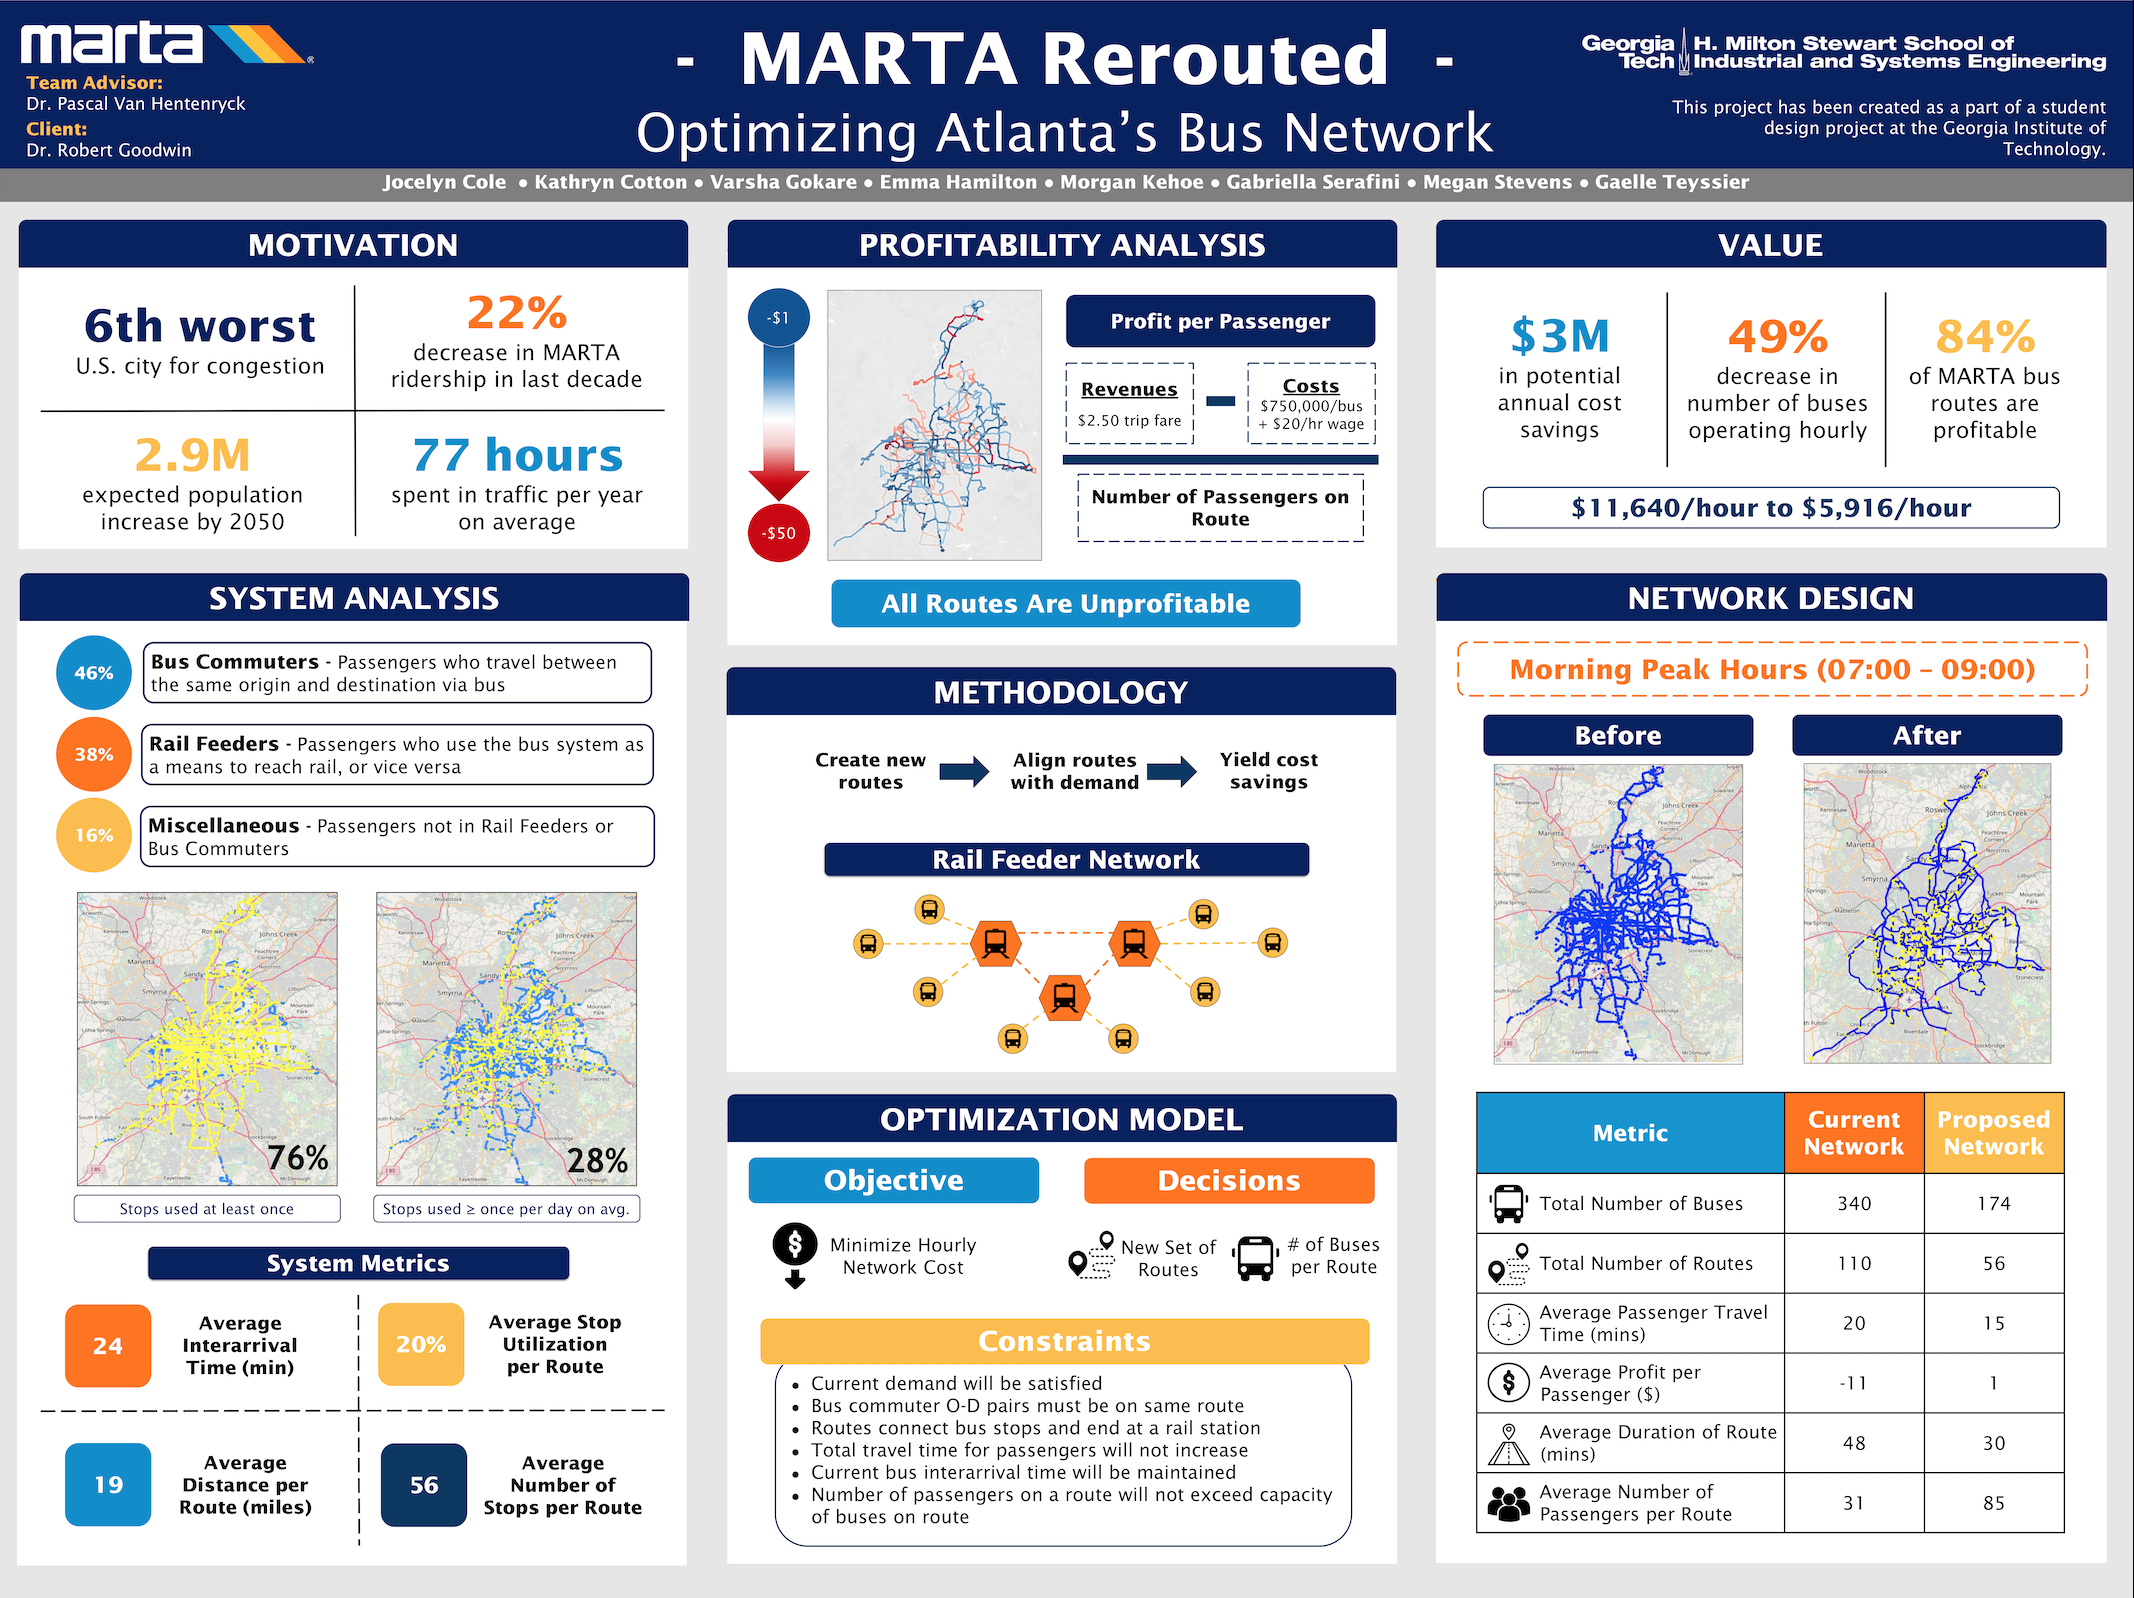
The Metropolitan Atlanta Rapid Transit Authority (MARTA) is the public transportation provider for the Greater Atlanta area. MARTA transports over 430,000 passengers by both bus and rail across a service area spanning 498 square miles. In the United States, it is the 8th largest rapid transit system by ridership with over 5 billion trips served since its opening. MARTA’s bus network accounts for approximately 30% of MARTA’s total ridership. Currently, MARTA operates 559 buses on 110 bus routes across the Metro Atlanta area. There are a total of 5,560 bus stops on these routes, each of which consist of 56 stops on average.
Project Objective
Within MARTA’s extensive bus network, only 28% of stops are used by a passenger at least once per day on average. The average number of stops utilized by passengers per route is 20%. The low utilization of the network as a whole in conjunction with the low utilization on a per-route basis indicates a mismatch between the network design and how passengers are using the system. As a result, the system is incurring high costs for serving areas where there is little demand. Additionally, analysis of profit per passenger for each route across six time blocks for an entire day shows that all routes operate at a loss, ranging between -$50 profit per passenger to -$1 profit per passenger. In total, MARTA’s profit per passenger across all routes is approximately -$1,000 per day. These findings serve as motivation to develop a new network that better aligns with passenger usage and reduces costs so that the subsidies MARTA currently receives can be applied elsewhere. Developing a new network that better aligns with current demand and has the possibility of using subsidies to look into improvements/expansion aligns with MARTA’s vision of “Taking people where they want to go today and tomorrow.”
Design Strategy
Through spatial and temporal analysis of bus commuter data, we determined that the best network design would be based on a rail feeder network where bus routes start on the outskirts of the city and go inward towards and ending at a MARTA rail station. This is a more integrated, multimodal design, that has been proven to show both cost reduction and improved service. We subsequently created an optimization model that outputs a new set of routes, the number of buses needed per route, and the cost per route. The objective of the model is to minimize the hourly network cost. We validated our approach by quantifying and comparing the results of the model through metrics observed in both the current bus system and the redesigned system.
Deliverables
1. Data Reports on System Usage
Prior to this analysis, MARTA did not have access to chained trip data and relied heavily on survey data. In order to provide MARTA with more accurate insights and improved visibility of the system, data reports on system usage will be provided. These reports are cataloged in Excel workbooks which will be submitted to MARTA following the conclusion of the project.
2. Hypothetical Redesign & Optimization Model
The hypothetical network will contain information regarding the number of buses on a route, the stops associated with each route, the time to traverse a route, and the interarrival time of buses on a route. Recall that the team did not create new bus schedules to accompany the suggested network as it was outside the scope of this project, so the deliverables do not include proposed schedules.
3. Route Profitability Tool
This tool is an Excel workbook that calculates and ranks the profitability of each MARTA bus route after inputting the route number and passengers per route.
Project Information
Student Team
Jocelyn Cole, Kathryn Cotton, Varsha Gokare, Emma Hamilton, Morgan Kehoe, Gabriella Serafini, Megan Stevens, Gaelle Teyssier
Faculty Advisor

Faculty Evaluator