Poster
Client Context
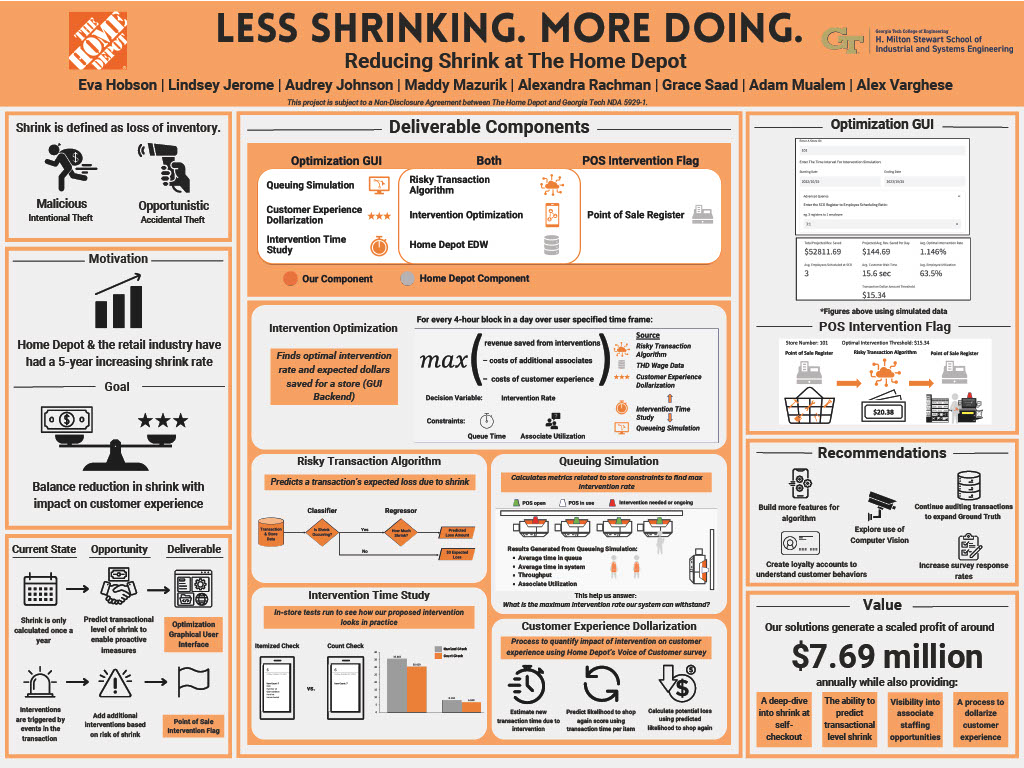
The Home Depot, Inc. (Home Depot) is the world’s largest home improvement retailer, earning $157.4B in revenue in fiscal year 2022. One of the biggest problems Home Depot faces is shrink – inventory lost due to operational errors or thefts – much of which occurs at self-checkout. Unaddressed, shrink could harm the company’s bottom line, threaten investor confidence, and lead to higher prices for customers or layoffs for employees. This project looked for ways to reduce the impact of shrink at self-checkout while minimizing the effect on customer experience.
A customer’s experience at self-checkout varies based on whether a transaction requires intervention – when a transaction is stopped, and an associate comes to assist the process. An intervention currently only occurs when prompted – for example, for a product that requires measurement. As customers are much less accurate when scanning their items, transactions where an associate intervenes are at a lower risk of shrink.
Project Objective
We identified two opportunities to reduce shrink at self-checkout: store-specific planning to ensure associates are intervening optimally and real-time flagging of risky transactions to prompt interventions.
Currently, Home Depot counts inventory only once a year to measure each store’s shrink. Their prediction model is used to estimate shrink in aggregate, and while it runs regularly, Home Depot is unable to make store-specific recommendations to reduce shrink or to account for seasonality. By predicting shrink at the transactional level, we enable more detailed analysis and provide store-by-store insights for managers, recommending optimal intervention levels for each store while showing how the optimal intervention level can change as self-checkout staffing changes.
Interventions currently only occur at self-checkout when an event occurs. By adding an intervention that occurs after the customer finishes scanning but before they pay, Home Depot can use the contents of the entire cart to proactively flag transactions with a higher risk of shrink. The transaction is flagged if the predicted shrink exceeds the store-specific threshold, alerting associates based on a transaction’s potential shrink. Associates can then arrive and check the transaction, correcting any potential missed scans.
Design Strategy
We developed five components that work to capture our two opportunities.
Risky Transaction Algorithm
The Risky Transaction Algorithm is a machine learning algorithm that will estimate the loss due to shrink by transaction. After running through a store’s historical transactions, it will create a distribution for a predicted loss due to shrink, which will then determine the optimal intervention threshold. By running a live transaction through the algorithm, it will produce a flag if the predicted shrink surpasses the threshold. The algorithm was split into a classifier and a regressor, which were validated using an F1 score and the root mean squared error (RMSE) respectively. The classifier has an F1 score of .219 out of 1 and the RMSE was $14.9.
Intervention Time Study
The Intervention Time Study found an estimate of the time that the new proposed intervention would take. In a closed Home Depot store, the team ran fake transactions with interventions to measure the average time of intervention and associate accuracy. The new intervention is approximately 30.429 seconds and associate accuracy was 98%.
Queuing Simulation
The Queuing Simulation ensures that by increasing interventions, the queue length and associate utilization remained within Home Depot’s set constraints of 80% utilization and a queue length of no more than 140% of the current state. The simulation’s accuracy was validated against historical throughput and time-in-system, with the simulated metrics differing from historical metrics by 8.5% and 6.3% respectively.
Customer Experience Dollarization
The Customer Experience Dollarization works capture the cost of intervention on the customer experience. Using data from Home Depot’s own Voice of the Customer survey, an optional survey customers can take after a transaction, the dollarization predicts the potential loss for a transaction based on the transaction time-per-item; as the time-per-item increases due to intervention, the cost increases.
Intervention Optimization
The optimization model returns the optimal intervention rate, customized to store and desired date range. It considered the value of the captured shrink as well as the cost due to labor and customer experience, as well as the queue length and employee utilization. The optimization model is a cumulation of the other four components, so the validation for those components can be applied here. It was also validated by our profit valuation.
Deliverables
To address the first opportunity, we created the Optimization Graphical User Interface (GUI ). The Optimization GUI is a tool for management to proactively reduce shrink. It includes all five components we created: the Risky Transaction Algorithm, the Intervention Optimization, the Queuing Simulation, Customer Experience Dollarization, and the Intervention Time Study. The GUI takes a store ID, date range, and current register-to-employee ratio as inputs, then calculates the store's average optimal intervention threshold and finds projections for savings and other key metrics over the date range when associates intervene on transactions above the suggested intervention threshold. This tool helps managers optimize their intervention rate to capture shrink and make informed staffing decisions by allowing them to see how key metrics can change as employee staffing changes.
To address the second opportunity, we created the Point of Sale (POS) Intervention Flag. The POS Intervention Flag uses two main components: the Risky Transaction Algorithm and the Intervention Optimization. The Risky Transaction Algorithm parses through each transaction and uses a machine learning model to provide an expected loss due to shrink. The Intervention Optimization reviews each store's historical transactions and outputs a threshold at which intervening upon a transaction is profitable. Home Depot’s POS system then compares the expected loss of a transaction with the store’s optimal intervention threshold to prompt interventions by an associate in real-time without being overly disruptive to the customer experience or introducing much additional labor cost.
Value and Impact
Quantitative Impact
The estimated annual profit that Home Depot could save by intervening optimally using our current model across all stores is $7.66M; however, the Risky Transaction Algorithm is currently underpredicting shrink instances between 9.3 to 195.4 times, and savings would increase with an improved algorithm. If the Risky Transaction Algorithm were more accurate, the potential profit would be approximately $140.28M.
Qualitative Impact
We have provided The Home Depot with a method to inform decisions about shrink moving forward, providing transactional-level insight into shrink that was previously unavailable. The project also enables the first step to optimizing employee staffing through the Optimization GUI, allowing store managers to adjust their staffing to best capture shrink while maintaining low costs. Finally, the project provides an initial methodology to measure the value of the customer experience, which Home Depot was not previously able to capture.
Project Information
Student Team
Alexandr Rachman, Adam Mualem, Alex Varghese, Audrey Johnson, Eva Hobson, Grace Saad, Lindsey Jerome, Maddy Mazurik
Faculty Advisor

Faculty Evaluator