Poster
Client Context
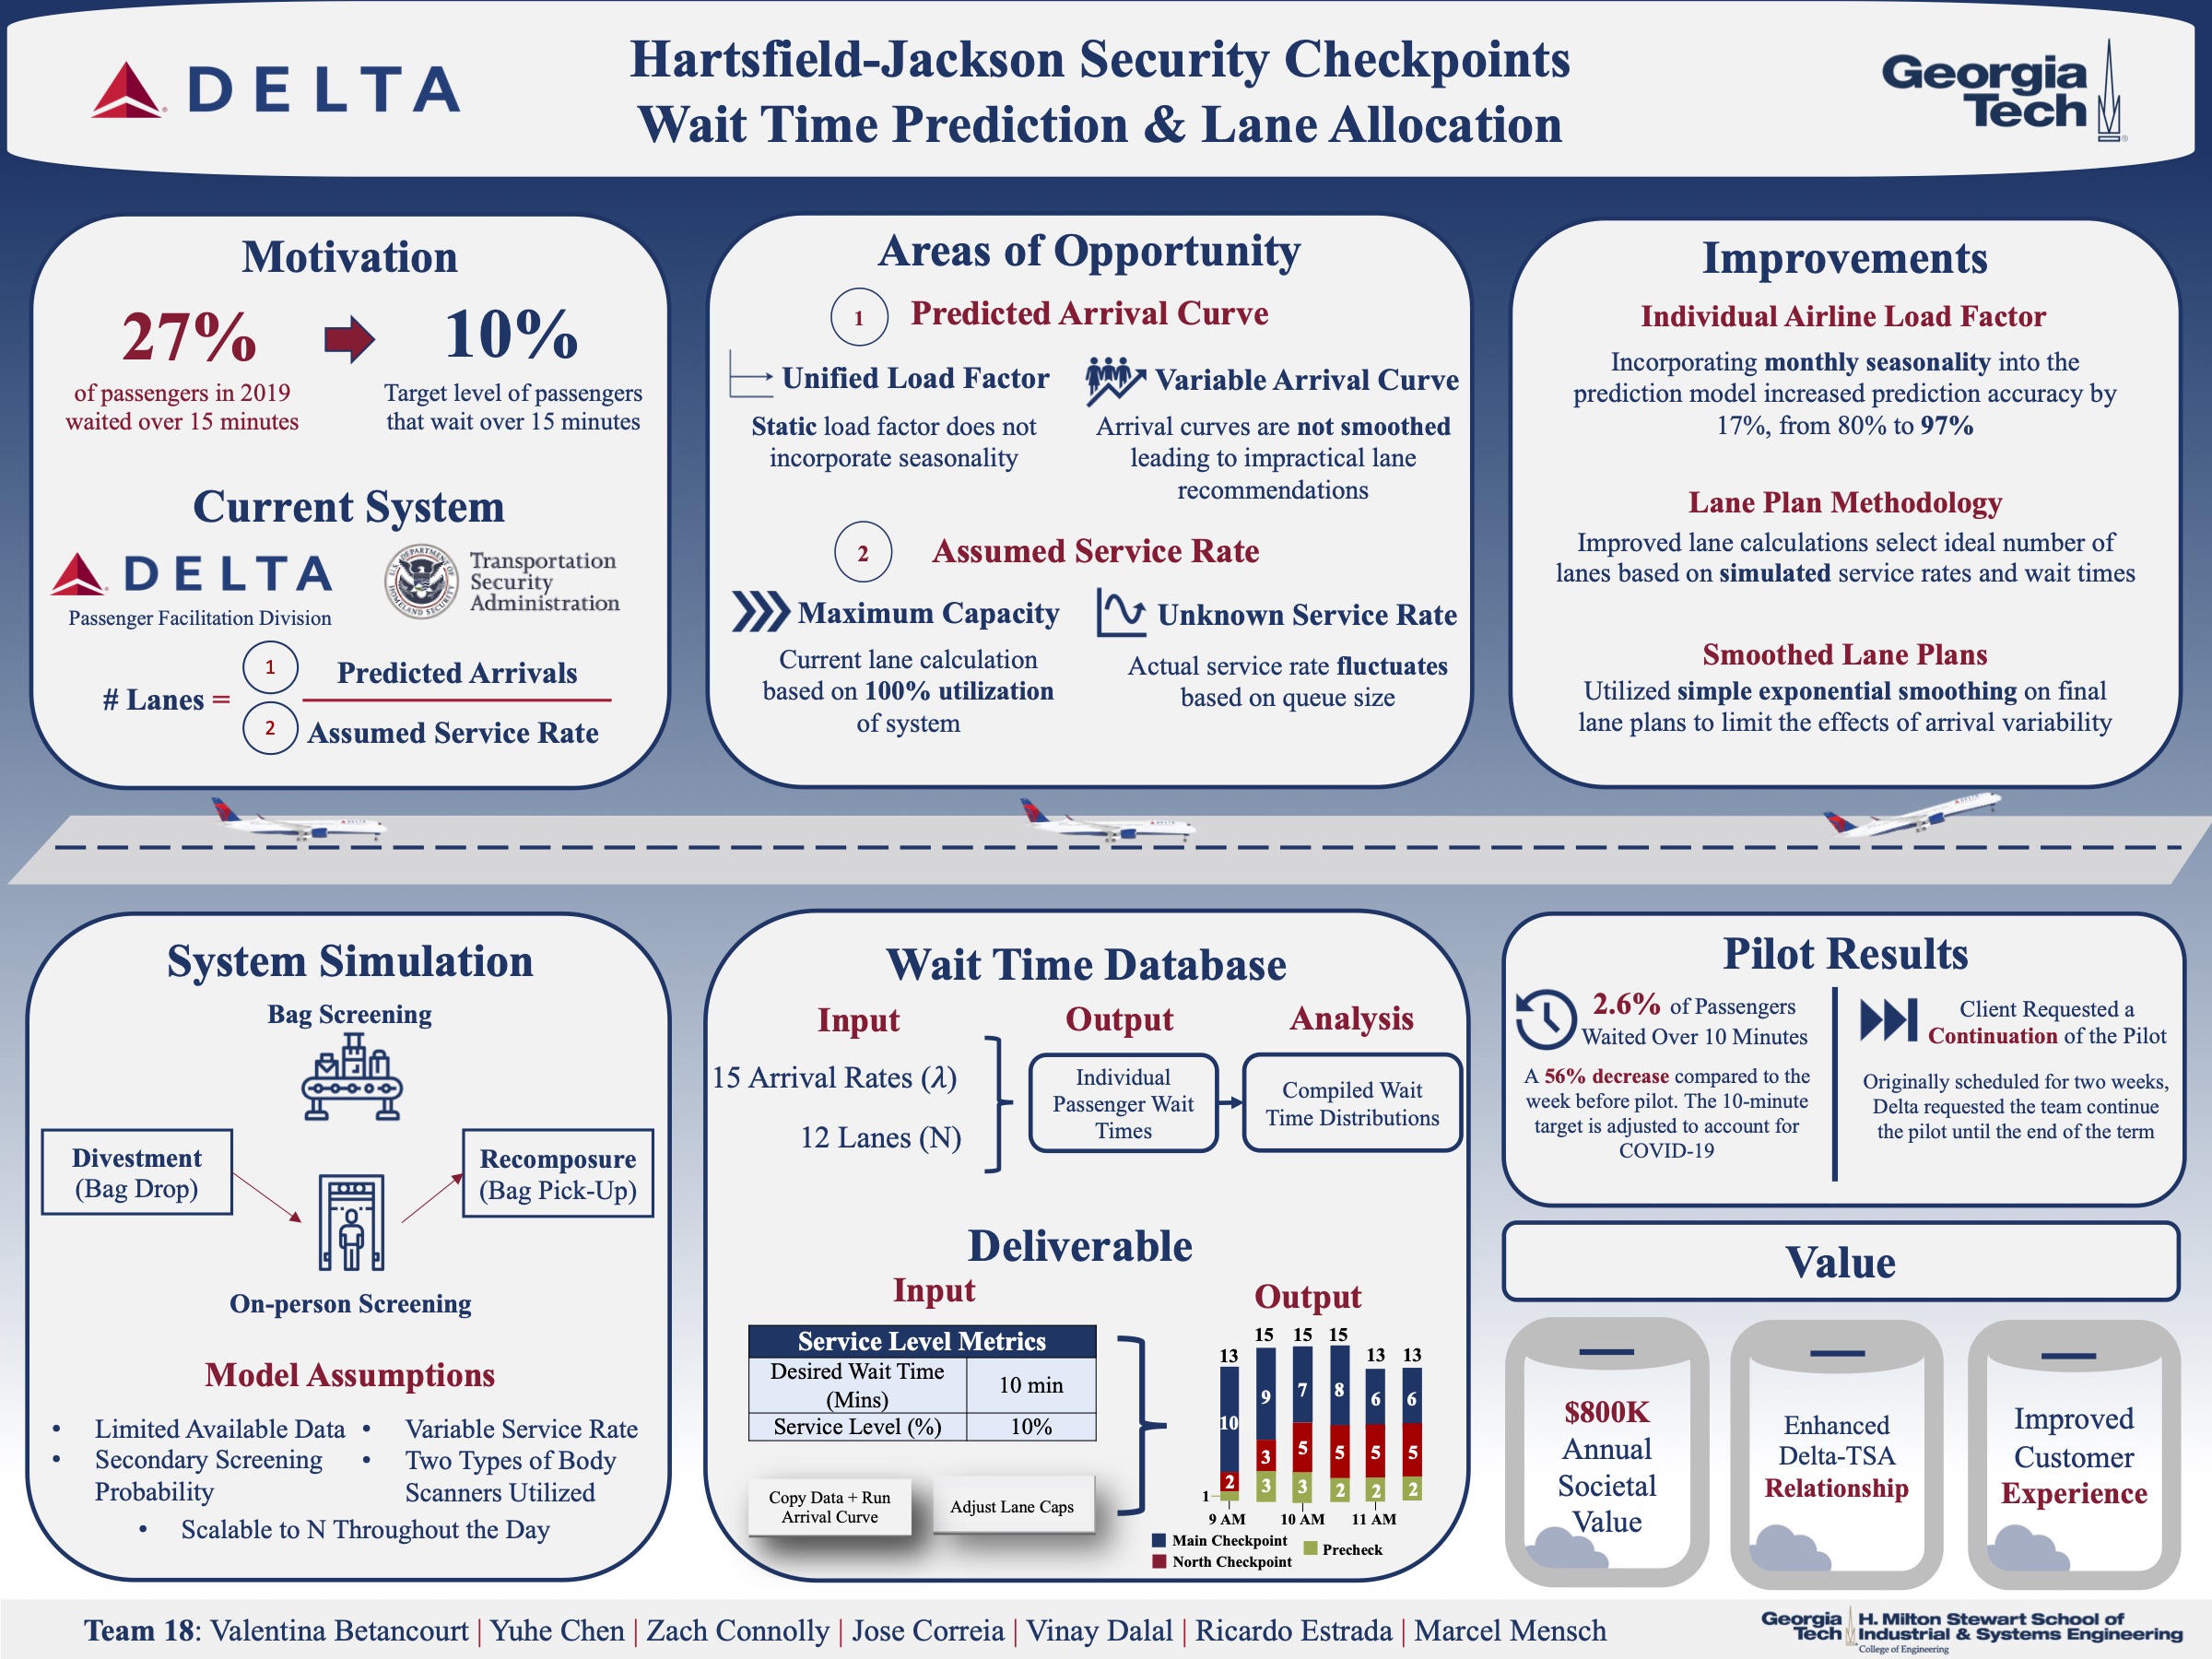
Delta's Passenger Facilitation Division consults TSA on checkpoint operations to improve the travel experience for the over 49 million domestic passengers that originate from Hartsfield-Jackson each year. To assist with checkpoint operations, Delta's Passenger Facilitation Division provides TSA with daily lane plan recommendations. The process of creating lane plan recommendations consists of two factors: predicting passenger arrivals and calculating the number of lanes necessary to process those passengers. To predict passenger arrivals, Delta follows the following steps: gather flight schedules - Delta gathers the flight schedules for all outbound domestic flights originating in Atlanta. For Delta flights, the flight schedules include predicted passengers, which is the number of seats on the flight that have been purchased. Then, apply stationary load factor to other airline flights - For other airlines, number of purchased seats are unknown. Delta uses a publicly available historical load factor and applies this factor to the capacity of all other airline flights to calculate the predicted number of passengers. Lastly, group arrivals in 30-minute intervals - Delta uses a probability curve that relates the percentage of passengers that arrive in each 10-minute time period prior to their flight's departure time to group arrivals by time of day. The lane plan recommendations are then created by dividing the number of predicted arrivals per half hour by an assumed static service rate per security lane. The daily lane plan recommendations are then sent to TSA ahead of the days of operation.
Project Objective
Delta's Passenger Facilitation Division consults TSA on checkpoint operations to improve the travel experience for the over 49 million domestic passengers that originate from Hartsfield-Jackson each year. Last year, 27% of passengers experienced a wait time of over 15 minutes at the TSA Security Checkpoint. This project strives to reduce this metric so that no more than 15% of all passengers wait over 15 minutes. There are a few factors within the system that complicate the use of a static processing rate. Notably, there is variability in the processing rates and paths passengers can take through the checkpoint. There are seven unique servers, and each server has a varying processing time. Passengers also go through different combinations of these servers. In many instances, a person or their bag is flagged for secondary screening, which will lengthen the time spent in the server for that individual. TSA is also able to manipulate the service rate of the system, compounding the issue of using an assumed service rate. In times of low demand, TSA will often process passengers slower than their maximum processing rate in order to ensure safety. In periods of higher demand, they are able to process passengers faster in order to expedite the queue. These varied processing rates, along with time-varying arrival rates per half hour, create a system that is not in steady state. Without the assumption of a steady-state system, a static processing rate is unable to properly model the behavior of the security checkpoint system. A more robust understanding of the system should be used in lieu of traditional queueing formulas with static processing rates.
Design Strategy
Since Delta will not have access to the simulation model due to license restrictions, several possible scenarios that can take place at the security checkpoints were run in the simulation and the results were stored locally. A simulation wait time database was created encompassing wait time distributions for 228 different possible scenarios. The model was set up to record the passenger's wait times for each scenario and store them in log files. These files were later compiled and analyzed using a Python script to create a probability mass function (PMF) for each of the scenarios. These PMFs were inputted into a Microsoft Excel sheet that serve as the local database. With this compiled wait time database, lane plan recommendations are created using the scenarios provided. After the arrival curve is created for the day, each arrival is searched within the database to find the proper number of lanes to service those passengers. With this new methodology, lane plan recommendations can be created to respond to a desired service level. The input service level sets an upper bound on the percentage of passengers who wait over a specified amount of time. The service level parameters can be modified in any way by Delta to generate lane recommendations that meet dynamic goals.
Thirty representative days were chosen to validate the simulation model. The days were evenly picked from three buckets: low, medium, and high throughput days. Hourly wait times reported by TSA are not an average, but rather one or two data points collected each hour of the day (e.g. a snapshot). Thus, in order to be able to compare the average wait times per hour produced by the simulation model, a distribution of TSA wait times was created by clustering hourly wait times for low, medium, and high-volume days of 90 days of available data. Each of the 30 days chosen were simulated in 32 replications. Average wait times per hour obtained from the model were compared to the average wait times per hour from the clustered TSA wait times to ensure the output were representative. All days showed similar output to reality.
Deliverables
The deliverable for this project is a Macro-Enabled Excel Workbook that generates lane plan recommendations throughout the day. Delta and TSA will both interact with this deliverable in exactly the same way as current operations, by inputting daily flight schedules and select the day of the week that the schedules are for (e.g. Monday). The deliverable will then calculate the number of arrivals expected for that day at every 30-minute increment. Using the locally stored database, the Macro will look up the smallest number of lanes to open to achieve the desired service level. For arrivals between the set intervals, the deliverable uses linear interpolation on the two nearest arrival scenarios to recommend lanes for that period. Finally, the initial lane plan will be smoothed out to ensure the plans are feasible. Arrivals will often fluctuate throughout the day, which can lead to fluctuating lane plan recommendations. Smoothing the lanes ensures that TSA will not have to continually close and open lanes to match these patterns, but will have a more consistent and easy to follow staff schedule throughout the day. The deliverable can also recommend lanes based on a set wait time and service level. Loosening the service level by increasing the desired wait time or the percentage of passengers who can wait above that level leads to lower recommended lanes and can be helpful to TSA in times of limited staffing. A more rigid service level can be implemented in times of high passenger volume to ensure the proper amount of lanes are open to process passengers efficiently. When inputting a new wait time and service level, the deliverable will report the percentage change of labor required to meet the new metrics. This addition was brought on by the COVID-19 pandemic, as Delta recognized that there may be fluctuations in travel patterns that could cause a readjustment of goals in the short term. The extra labor reporting will help Delta to visualize the trade-off between wait times and number of lanes open for different passenger arrivals.
Project Information
Student Team
Valentina Betancourt, Yuhe Chen, Zach Connolly, Jose Correia, Ricardo Estrada, Marcel Mensch, Vinay Dalal
Faculty Advisor

Faculty Evaluator