Poster
Client Context
Georgia Power Company (GPC) is a private utility company and the largest subsidiary of Southern Company. GPC is publicly regulated by the public service commission and serves 97% of the counties in the state of Georgia. Since Georgia Power is the sole provider of its services in the state of Georgia, the public service commission has high expectations for GPC’s public image and customer perception.
Our team worked with the Distribution Engineering team specifically, the group responsible for maintaining and developing the power line system within the state. Georgia Power services four different regions containing several headquarters. For the scope of this project, our team worked on the improvement of the maintenance job scheduling system within the Southeast region which includes four headquarters: Brunswick, Hinesville, Springfield, and Statesboro.
A “job” is defined as a power line installation, maintenance, or service that is requested by a customer or arises from emergency and/or unforeseen circumstances (for example, inclement weather or a traffic accident).
Project Objective
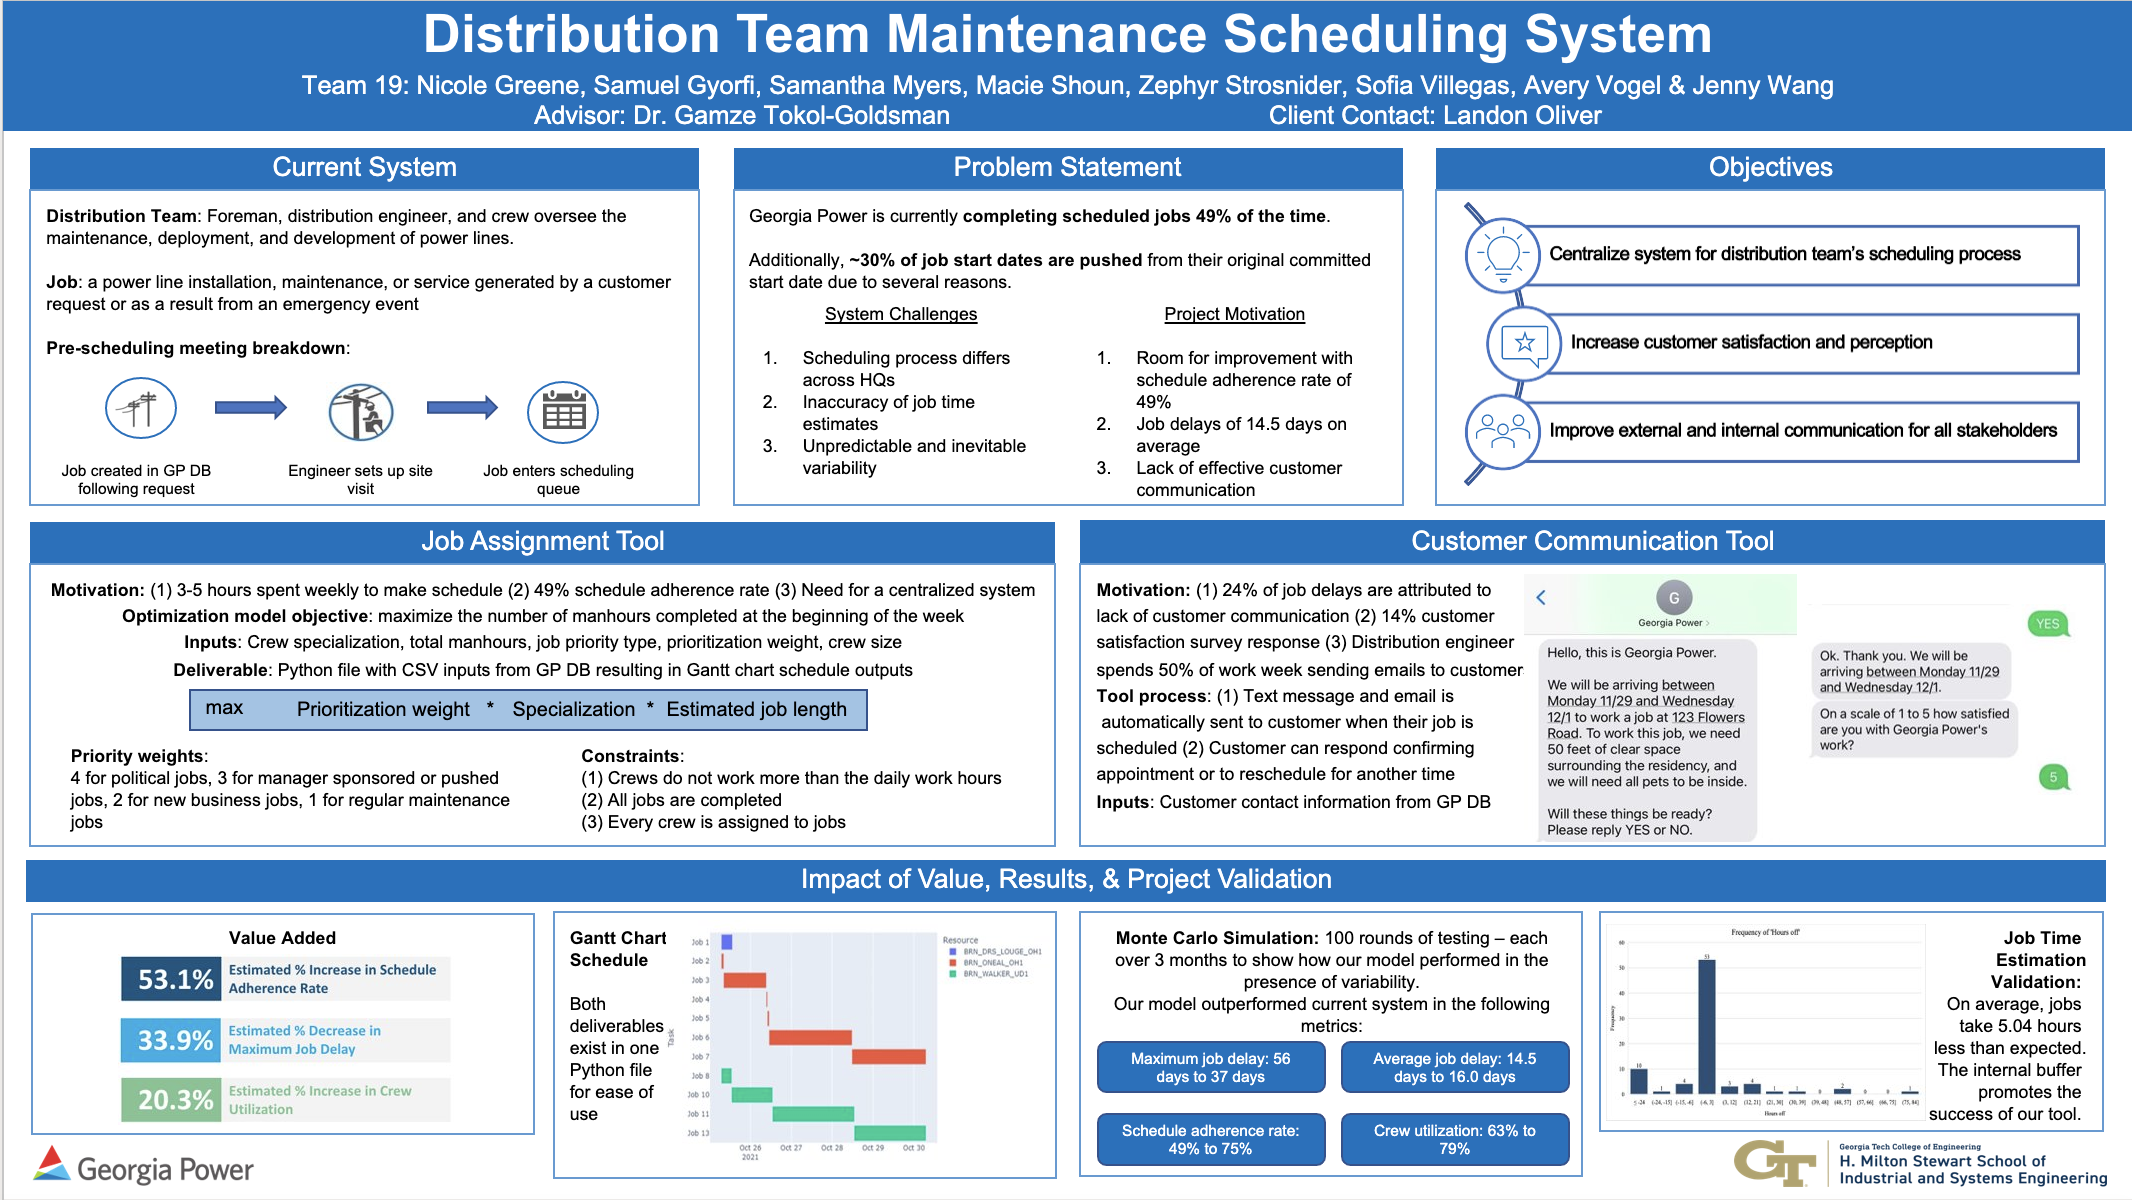
The objective of this project is to improve customer satisfaction and the efficiency of maintenance job completion by:
1. Streamlining the process of job scheduling through a job assignment model implemented in Python
2. Strengthening customer communication with the creation of a customer communication tool
Project Opportunitites:
Improving Schedule Adherence Rate
The schedule adherence rate for this system is defined as the percentage of jobs that are completed as they are scheduled – meaning jobs end within their allotted time. Georgia Power has a 49% schedule adherence rate in the current system. This means that less than half of all jobs are completed as they were originally scheduled. The client has found that when jobs are not completed on time, customer satisfaction is negatively affected. An increase in this rate would indicate that jobs are being completed by the committed date to the customer. This contributes to the efficiency of job completion and, in turn, customer satisfaction.
Decreasing Job Delays
For this system, a job delay is defined as a delay in a job’s start time. In Georgia Power’s current maintenance job system, approximately 30% of jobs are delayed based on this definition (Appendix E).
The breakdown of job delays are as follows:
56% of jobs are delayed due to administrative setbacks. These are caused by external contractors, groups, and partners not completing prerequisite tasks on time.
24% of delays are due to the customer not being ready.
16% of delays are caused by equipment issues or lack of availability.
4% of delays are caused by weather and other uncontrollable environmental factors.
The team identified that a solution could be created to alleviate part of the 24% of delays due to the customer not being ready. When crews show up to a job site where the customer is not ready, the crew cannot work. This wastes the time it takes to travel to/from the job site. In most cases, it also wastes the time allotted in the schedule for that job unless they can use the remaining time at another assigned job site. Improving communication with customers to ensure that scheduled jobs can be completed can reduce customer-caused delays.
Improving Customer Engagement
Georgia Power sends out a satisfaction survey via the current communication process (see Design Strategy: Communication Tool) to customers following a job’s completion. An analysis over four months resulted in a 14% customer engagement rate. Increasing customer engagement will give Georgia Power a more accurate and holistic view of customer concerns and satisfaction, allowing them to address issues that cause customer dissatisfaction.
Design Strategy
Optimization Model:
Design Motivation
Georgia Power’s current maintenance job scheduling system is time-consuming and arbitrary. Each week, the distribution engineer holds on average three scheduling meetings with crew foremen. In these meetings, the engineer shows a list of jobs to be completed that week and goes through each one, assigning it to a crew on specific days with the help of the foremen input. The distribution engineer then manually creates the physical schedule to be sent out. This schedule is sent to the foremen, who in turn communicates with their crews regarding where they need to be and on what day of the week.
Design Solution
To improve the maintenance job scheduling process, we developed an optimization model that schedules jobs assigned to crews for the upcoming week. Georgia Power uses a weekly schedule as their time frame to ensure the most accurate and up to date job information and crew availability is available when scheduling jobs. The model inputs are a job’s total manhours, the number of workers on each crew, the job’s prioritization weight, and a binary variable indicating crew specialization.
The objective of the model is to maximize the number of manhours completed earlier in the week, leaving a buffer for emergency jobs, delays, and other variability at the end of the week. The model’s constraints ensure that all crews are assigned to jobs each week, each job is allotted the correct estimated completion time, and, in normally scheduled weeks, crews do not work more than 8 hours per day. The model also considers the priority level of the job, based on various factors such as if the job was previously delayed or the client is a key customer.
Data & Methodology
Georgia Power’s current method for estimating job times divides total manhours by the assigned crew size. To validate this calculation, we found that, on average, jobs take 10% less time than estimated. This means that jobs are allocated 10% more time in the schedule on average than is needed to complete the job. This inherently adds an internal buffer in the schedule for daily job time variability. Since most jobs take less time than they are allotted in the schedule, the rare jobs that take longer than estimated are unlikely to cause major delays thanks to this internal buffer.
The prioritization weight is calculated based on job priority types, listed in order of decreasing priority with 4 being the highest priority and 1 being the lowest as follows:
4: Political jobs
3: Manager-sponsored jobs, unfinished jobs, and jobs pushed from previous weeks
2: New business jobs
1: Regular maintenance jobs
A job can have multiple priority types, and the weight is calculated accordingly. For example, if a job is manager-sponsored as well as a new-business job, the weight will be 3+2=5.
All crews can complete most jobs, but in the rare case that a crew is not qualified to work a particular job, the binary specialization indicator is zero.
The model is implemented in Python. When a distribution scheduler is ready to run the model, they upload a Comma-Separated-Value (CSV) file containing information about jobs, such as priority and estimated duration, and information about crews, including availability. The model then schedules jobs on days consecutively throughout the week. There is also an option for the user to input the number of weekdays that should be included in the schedule. If the distribution engineer only wants jobs to be scheduled Monday through Wednesday, they can just input “3” into the field and Thursday and Friday will be left open. The outputs of the model are a CSV file containing job assignments and a Gantt chart displaying the week’s schedule.
Results and Discussion
To validate our model, we simulated its performance against the current system with randomly generated variability in a Monte Carlo model. A Monte Carlo model was used because it is necessary to understand the likelihood of the simulated results along with the expected outcome to truly validate the solution. To create the job distribution utilized in the Monte Carlo simulation, the team turned to Georgia Power’s historical job data. For job durations, the data input into the model were GCP’s estimated job lengths in order to reflect real occurrences as much as possible. The anticipated job lengths are on average 10% faster than realized job lengths. Job delays have been organized into four categories to simulate actual system variability: equipment, customer, administrative, and weather. The average length of each specific type of job delay and the likelihood of that specific type of delay were factored into the Monte Carlo schedules to keep results realistic.
To measure the success of our model, we created four key metrics to compare the current state of the system to our proposed solution. Using data provided by Georgia Power we were able to track these metrics with the current system and using the simulation model we were able to track metrics for the proposed system.
The schedule adherence rate indicates how often a created schedule is completed on time and is therefore the most significant metric relating to the client’s goal of less frequent delays. This rate increased from 49% in Georgia Power’s current scheduling system to 75% in the proposed scheduling system. This metric is at the center of the project’s motivation – completing jobs within the week that they are initially assigned to. Our project’s motivation derives from the fact that with a 49% schedule adherence rate, there is room for improvement in the system performance. An increase to a 75% schedule adherence rate represents this desired improvement.
The maximum job delay shows the range of job delay time. As a reminder, Georgia Power defines delay as a delay in a job start time. The simulation found that the maximum job delay for the current system is 56 days, while our model had a maximum job delay of 37 days. The range of job delay time is shortened, meaning customer jobs can be completed earlier. This is especially key for customers who require work that has a low priority. Despite the lower priority, Georgia Power still values its relationship with these customers and therefore aims to decrease time that any customer waits.
The average job delay remained relatively stagnant, increasing from 14.5 days in the current system to 16 days in the new system. While this metric did not necessarily improve, the team considers a stagnant result to be a success. Similar average job delays means that our model is successfully taking into consideration the inevitable variability that is out of Georgia Power’s control, such as permit applications, supply chain blocks, and inclement weather.
Crew utilization increased from 63% in the current system to 79% with the use of the optimization model. This increase means that crews will spend about 20% more time working than they do in the current system. Foremen have expressed frustration regarding the idle and wasted time caused when crews arrive at an unworkable job site, or when jobs are cancelled/delayed last minute. This is not being prevented by our model but can be reduced by 10.8% by the communication tool. The foremen say that this increase in utilization is realistic for the crews to complete. The team believes that this utilization will be sustainable because crews are already on call for work before delays occur at the last minute.
Overall, the compared average metrics measured in the Monte Carlo simulation indicate that the optimization model more often creates shorter delays than Georgia Power’s current scheduling system. With the addition of a buffer at the end of each week and increased crew utilization, jobs that are delayed or pushed can start earlier than they could in the previous system because crews have more availability at the end of each week.
Communication Tool:
Design Motivation
The distribution team’s current communication process is time-consuming and unintuitive. The distribution team has expressed that they spend about 50% of their week manually sending emails to customers regarding job communication and are often unable to send another message if a job is delayed.
Design Solution
The proposed communication tool cuts down several steps to help the distribution team save time. By integrating the tool with the job allocation model in Python, customers can be updated in real time as the schedule changes. When a schedule is finalized or updated, this tool will send affected customers a message (via text and/or email) to verify if the job site is ready for the crew to work on or not as opposed to just notifying them of their arrival. This extra step will help reduce some customer related job variability and reduce the back-and-forth required by a frequently changing schedule.
Data & Methodology
Jobs are delayed due to a variety of factors including weather, emergencies, customer availability, job site readiness, and last-minute changes in crew availability. Since the client chose not to pursue equipment availability or administrative setbacks due to the need for difficult outside coordination, the only job delay segment included in the scope of the project’s tools is related to customer responsiveness and readiness. We define delays caused by customers as jobs that cannot start at the scheduled time because the customer’s site is not ready for the crew. Some examples of customer-caused delays include wiring on site not being properly prepared, not clearing a path to a job, or a customer not being home to let a crew into their backyard. Creating a customer communication tool allows Georgia Power to effectively coordinate crew arrival times, job site readiness, and any concerns or issues that arise. Ensuring customer and site readiness prior to scheduling jobs will reduce delays and unproductive crew time caused by customer unreadiness.
To remove the time-consuming aspect of communicating with customers, we have added an automated text-messaging and emailing aspect to the Python file containing our job assignment model. The text messages are sent via a cloud communication platform, and the emails are sent via Microsoft Outlook. When the schedule is created, the user has the choice to notify customers affected by the schedule through a yes or no prompt in the Python script. The program automatically triggers an email and a text message to the affected customers informing them that work is scheduled to be done on their property in the upcoming week. The customer can then inform Georgia Power if they are prepared for crews to perform work in that week. The texts continue based on the customers responses. The customer satisfaction survey is also sent through the communication tool once a job is completed.
Results and Discussion
The goals of the communication tool are to both increase customer engagement as well as reduce customer related delays. Although we were not able to physically validate our model, we were still able to validate based on real world industry data. Gartner, a technology research and consulting company, published that email response rates are about 6% while SMS response rates are about 45%. Using these statistics, we can assume that through introducing SMS we will receive a 45% response rate for our scheduling updates which will reduce customer related variability by that amount. This totals to an estimated 10.8% reduction in total system variability due to the communication tool.
Deliverables
There are two main deliverables for Georgia Power: the job assignment optimization tool and the communication tool. The tools are combined and will be given to Georgia Power as a single Python file. The Python file, when run, will produce job assignments for the week as well as a Gantt chart displaying the job schedule. If the option is selected, the file will also send messages to customers and follow ups based on the jobs scheduled. The team also plans on providing Georgia Power with a packet on how to use this combined tool. This includes a guide on how to download and use Python, how to use the optimization model, and how to edit messages with the texting tool and the automated Microsoft Outlook email responses.
Project Information
Student Team
Nicole Greene, Samuel Gyorfi, Samantha Myers, Macie Shoun, Zephyr Strosnider, Sofia Villegas, Avery Vogel, Jenny Wang
Faculty Advisor

Faculty Evaluator