Poster
Client Context
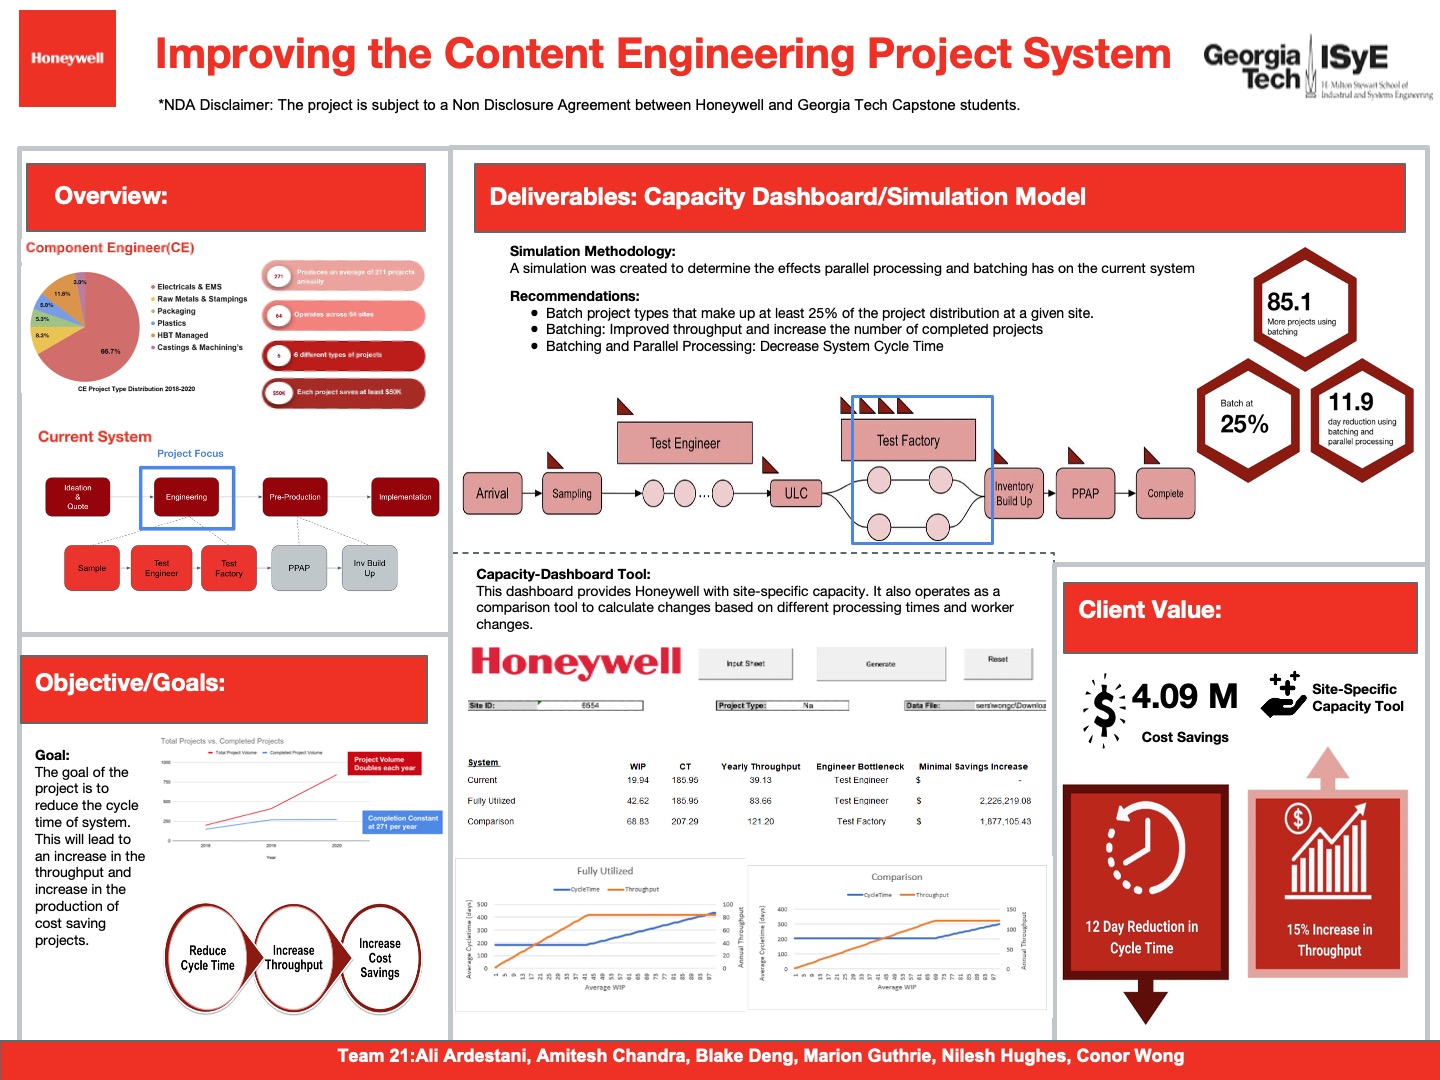
Honeywell International Inc. is a Fortune 100 company with over 100,000 employees and manufacturing sites across the entire globe. They manufacture in four main industries: aerospace, building technologies, performance materials and technologies, and safety and productivity solutions. Honeywell’s Product Lifecycle Management Division is responsible for implementing changes to a products’ manufacturing process in the form of a Component Engineering(CE) project. They operate at sixty four different sites currently. CE projects typically involve switching out a single component of a product for a financial benefit or a functional improvement to the product. To implement a CE project, it must go through the following steps: ideation, engineering, and pre-production. At ideation an improvement idea is created and quoted to check if it can save a minimum of $50,000. At engineering it goes through rigorous sets of testing to ensure functionality is maintained. In pre-production suppliers are vetted and inventory is built up. After this process a project can be successfully implemented.
Project Objective
The current system is operating above capacity at multiple sites. The data showed that 6 of the 64 sites received 56% of the total volume of projects. This uneven distribution has resulted in an increase in the average cycle time. This has also potentially reduced the system throughput.
Based on the initial data that was provided to the team, batching has been detected at various sites. However, according to the client, engineers start on projects at their own discretion and there are no standards for batching at any section in the system.
The project objective is to increase Honeywell’s CE production savings by. By rebalanced utilization across sites overall cycle time can be reduced. By implementing batching guidelines, throughput can be increased.
Design Strategy
Through meetings with engineers and processing time data, the team was able to create a simulation model of a sites project flow. Many simulation iterations were generated to create confidence intervals to compare to a site's actual production. When the model was validated, the team created different variations of the model to investigate changes to system performance when batching and parallel processing was implemented.
Using processing times at different stations and the number of workers at each place, a recommended capacity could be calculated. The simulation model was also used to test capacity recommendation.
Deliverables
Capacity Dashboard
The Capacity Dashboard allows users to find a site's capacity, cycle time, yearly expected throughput as well as which of the two engineering sites is the system's bottleneck. The user can either upload an excel output from the aforementioned productivity deck, or input the average processing times for each milestone. The user would then have to choose the project type as well as how many engineers of that type exist within the system. With this data the macro will calculate the current system capacity as well as the capacity at maximum utilization before there are projects waiting in queue. While this output may not explicitly make recommendations, it does allow the client to compare the current site to different states. The client can test how changes to the system can affect the work in process, cycle time, throughput, the bottleneck and savings. This will allow the client to make informed decisions about the two engineering sites based on theoretical changes and outputs.
Batching Recommendations
The team tested three changes to the production process at the Engineering step: batching, parallel processing, and both. The team found that the greatest overall reduction in cycle time was shown when implementing Parallel Processing and Batching in tandem. The client can use their own discretion at different sites whether to implement Batching or both Batching and Parallel Processing. Ultimately the lowest project type makeup percentage that allowed for beneficial batching was found to be 25%.
Project Information
Student Team
Ali Ardestani, Amitesh Chandra, Blake Deng, Marion Guthrie, Nilesh Hughes, Conor Wong
Faculty Advisor

Faculty Evaluator