Poster
Client Context
The Georgia Department of Public Health (DPH) aims to create healthy families and communities for all Georgians and state visitors. They collaborate with 159 Georgia county health departments and 18 public health districts to provide support and information to protect Georgian lives.
Throughout the Covid-19 pandemic, Georgia schools have been faced with decisions regarding Covid-19’s impact on education. Currently, the system has a decentralized decision-making process where Covid-19 policies are made by school decision-makers on a school-by-school, district-by-district basis. Many Georgia schools are not adequately equipped to navigate these decisions. Schools do not have access to reliable and centralized information on the effects that masking, surveillance testing, and vaccination could have on the spread of Covid-19. Therefore, to support schools, DPH individually provides school decision-makers with Covid-19 protocol guidance.
Project Objective
Schools are facing the challenges of weighing the benefits and risks of in-person learning to determine the best route for their students, staff, families, and communities in response to Covid-19. Within Georgia, most schools have reopened for in-person learning, but they are unable to look to the state, county, or Board of Regents for clear guidance on protocol decisions given the discrepancies in recommendations and mandates at each level. Furthermore, most school decision-makers do not have the expertise or consolidated data to independently navigate the complexity of the decision-making process. With Georgia schools constantly relying on DPH to understand the implications of interventions within their school, it has become overwhelming for DPH to address the high volume of requests.
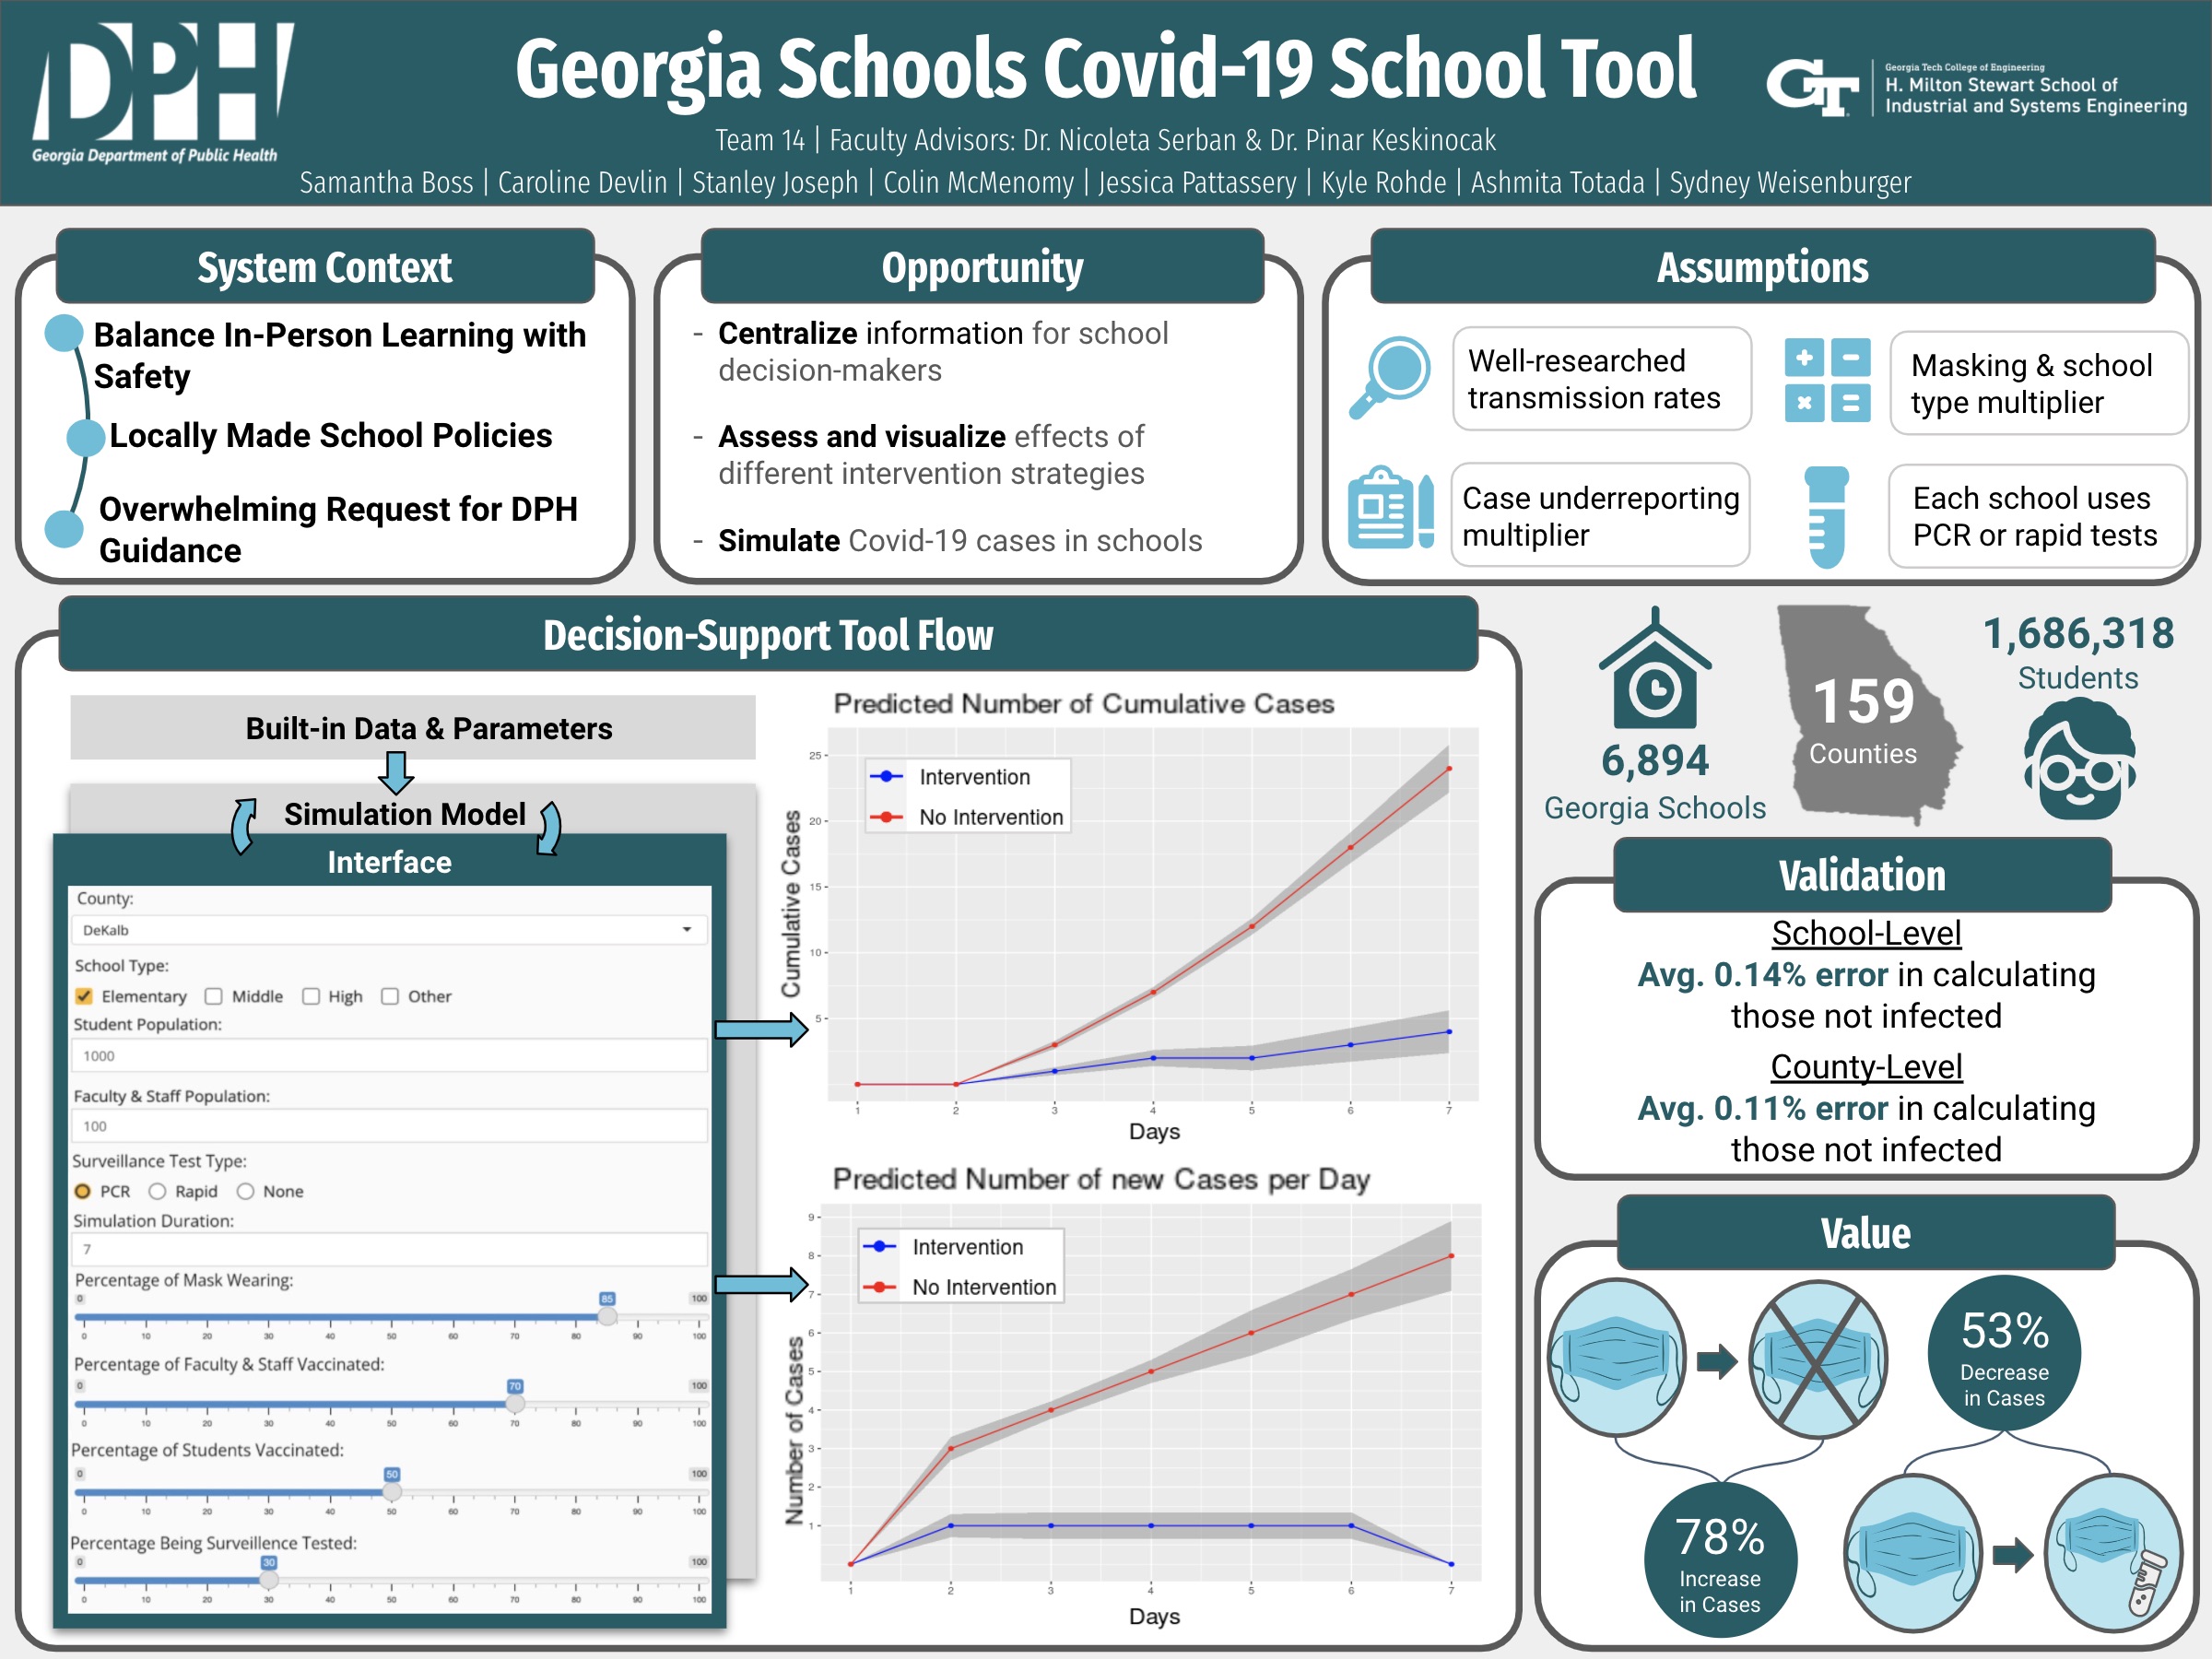
To address the overwhelming demand that DPH is facing for Covid-19 protocol guidance in schools, DPH proposed the centralization of information for school decision-makers to assess and visualize effects of different intervention strategies by simulating Covid-19 cases in schools. To do this, we are providing DPH with a simulation model, which projects cases based on different levels of intervention strategies (masking, vaccination, and surveillance testing), along with a decision-support tool, which intakes user inputs and displays the corresponding case projection graphs on the web page. This combination of deliverables, along with the decision-support tool documentation and simulation model documentation, will equip school decision-makers to make data-driven decisions when implementing intervention strategies and lessen the workload for DPH.
Design Strategy
The Georgia Institute of Technology, North Carolina State University, and DPH collaborated to create a simulation model to simulate the effects of surveillance testing on the spread of Covid-19 on college campuses (Yu, Fujimoto, Keskinocak, & Swann, 2021). This foundational Covid-19 testing model is based on a Susceptible-Infected-Recovered (SIR) epidemiological model, which is extensively used in research for epidemic spread. The foundational model solely considered the effects of surveillance testing as the intervention strategy to reduce the spread of Covid-19 in schools. The simulation model we developed expands on the foundational model, with additional parameters for the effects of masking and vaccination to account for a wider range of intervention strategies that exist in schools. To analyze different combinations of intervention strategies, the model takes in two types of parameters: built-in data and parameters as well as user inputs. The following researched built-in data and parameters are fixed and predetermined, and they are integrated into the back end of the simulation model: transmission rates due to contact with (a)symptomatic, (un)vaccinated individual, rate of recovery for an infected individual, proportion of infections that are (a)symptomatic, isolation compliance (a)symptomatic infected and tested patients, and false negative rates of a rapid test for (a)symptomatic patients. User inputs are parameters that school decision-makers will input into the decision-support tool interface so that the simulation model can project cases using school information: county name, school type, student population size, faculty & staff population size, type of surveillance testing (PCR, Rapid, None), simulation duration (in days), percentage of population wearing masks, percentage of population participating in weekly surveillance testing, percentage of students vaccinated, and percentage of faculty & staff vaccinated. We validated our developed simulation model by conducting sensitivity analysis, county-level validation, and school-level validation.
We performed two types of sensitivity analysis to assess the robustness of the model: sensitivity analysis with respect to the transmission rate (beta; Bn) and sensitivity analysis with respect to case projections. To assess the sensitivity with respect to transmission rate, each rate was uniformly distributed from the range [0.75Bn, Bn]. This is because, as our transmission rates account for the presence of the highly-infective Delta variant, we wanted to ensure the transmission rates were at most that of Delta. Each transmission rate was sampled 40 times uniformly (greater number of sampling could lead to significant runtime), and the case projections were recorded with all other transmission rates constant. This process was repeated for each transmission rate. After 40 case projections were produced, the mean and standard deviation of these values were taken. The coefficient of variation (CV) was then calculated by taking the ratio of the standard deviation to the mean. The sensitivity with respect to case projections was also assessed to see the variation in how the model predicts cases per day per iteration. In this case, all transmission rates were sampled from the uniformly distributed [0.75Bn, Bn] range, and the model was run 40 times to provide 40 case projections over 14 days. The mean and standard deviation of case projections were calculated per day, i.e. the mean and standard deviation for iterations 1 through 40 on day one, and so on, were respectively recorded. The CV was then calculated by taking the ratio of the standard deviation to the mean.
To validate the model at the county level, we compared the number of observed cases obtained from DPH’s website to the model’s average predicted number of cases for each county. We scaled the observed number of cases at the county level by a uniformly and randomly selected underreporting multiplier between 3.4 and 4.7 (Estimated Covid-19 Burden). We set the masking compliance to 50%, the percentage of the population getting PCR tested to 50%, and used the vaccination percentage by county data posted on DPH’s website prior to running the simulation model, as directed by DPH, to simulate the average policies and practices being seen across all 159 counties. Once these values were set, we ran the simulation model 10 times (as opposed to 40 due to increased run-time errors) for each county for a two-week period and calculated the average number of predicted cases per county. Next, we compared the average number of predicted cases to the scaled number of observed cases for each county, calculating the overall difference between the two values, the percent error of those infected, and the percent error of those not infected. We executed this process for validation five times in order to assess the model’s performance with new data sets of observed cases being posted by DPH.
To validate the model on a school level, we ran the simulation model for 50 schools in Georgia. Each of the schools we tested had varied intervention strategies, community and school types, and population sizes to ensure that the simulation model was representative of the diverse range of Georgia schools. We compared the actual number of Covid-19 cases for each of these schools to the simulation model case projections to assess accuracy.
Deliverables
The deliverables to the client are a simulation model utilized within a decision-support tool, along with two types of documentation.
1. Simulation Model
The simulation model is written in R and incorporates built-in data and parameters, as well as user inputs. The model runs its corresponding R script and outputs two graphs: number of new cases per day and number of cumulative cases throughout the simulation. Additionally, the simulation model sends supplemental explanations for the information found in the graphs to the interface. The simulation model can be adapted for application across multiple school environments by changing the user inputs entered into the decision-support tool interface, and can also be adapted to new mutations and evolving information about the spread of Covid-19 by changing the built-in data and parameters in the back end, which is explained in the documentation. This is useful for the client as they will be able to make changes regarding new information obtained about the Covid-19 virus and be able to make adjustments to the back-end of the decision-support tool.
2. Decision Support Tool
The tool’s interface is a web page created using R Shiny, an R package used to create web applications. This is beneficial both for DPH and for the schools that they support. On DPH’s side, a web page hosted through Georgia Tech Web Hosting Services can be easily distributed to school decision-makers, and the low barrier of entry for the decision-makers’ access to the tool addresses DPH’s concern of being overwhelmed with requests for information. Furthermore, maintaining the tool will be easier because any changes to the variables’ values in the simulation model script would automatically update for all users. From a school perspective, a web page is easily accessible without any installations or downloads needed. This web page is simple to use with user input boxes and continuous sliders to adjust the parameters. In addition, when a user hovers over each input in the decision-support tool interface, clarifications are provided to further explain what the user should be inputting. There is also a “User Guide” tab, teaching users how to use the tool and interpret the outputs. With each run of the model, the user is also provided an explanation for how to interpret the graphs and a projected percentage of students quarantining due to contracting Covid-19 to equip them to evaluate the trade-offs of their decisions. See Appendix K for a visual of this web page and its functionality. The model is written into the back end of the web page, hosted on a Georgia Tech server. The front end intakes the user inputs, connects them to the model as variables, and runs the simulation. Output graphs are displayed to the user, along with CDC Covid-19 guidelines and a user guide. From there, the user can continue comparing various scenarios to visualize the impact of different interventions and make informed protocol decisions aligned with their school’s acceptable level of risk.
3. Documentation
A. Simulation Model Documentation
We are providing DPH with documentation about how to update, expand, or troubleshoot the simulation model. The documentation first introduces the decision-support tool, explaining the changes to the foundational Covid-19 testing model to include the effects of masking and vaccination on the spread of Covid-19 in schools. It also contains a list of values for the built-in data and parameters, as well as the sources referenced to determine those values. Additionally, it explains each block of code in the simulation model and county-level validation to be referenced if DPH decides to modify the code to reflect changes regarding new information about Covid-19.
B. Decision-Support Tool Documentation
We are also providing DPH with decision-support tool documentation, outlining how to use the interface and interpret the outputs. School decision-makers can also reference this documentation in the “User Guide” tab within the web page to get the most value from the interface.
Project Information
Student Team
Samantha Boss, Caroline Devlin, Stanley Joseph, Colin McMenomy, Jessica Pattassery, Kyle Rohde, Ashmita Totada, Sydney Weisenburger
Faculty Advisor

Faculty Evaluator