Poster
Client Context
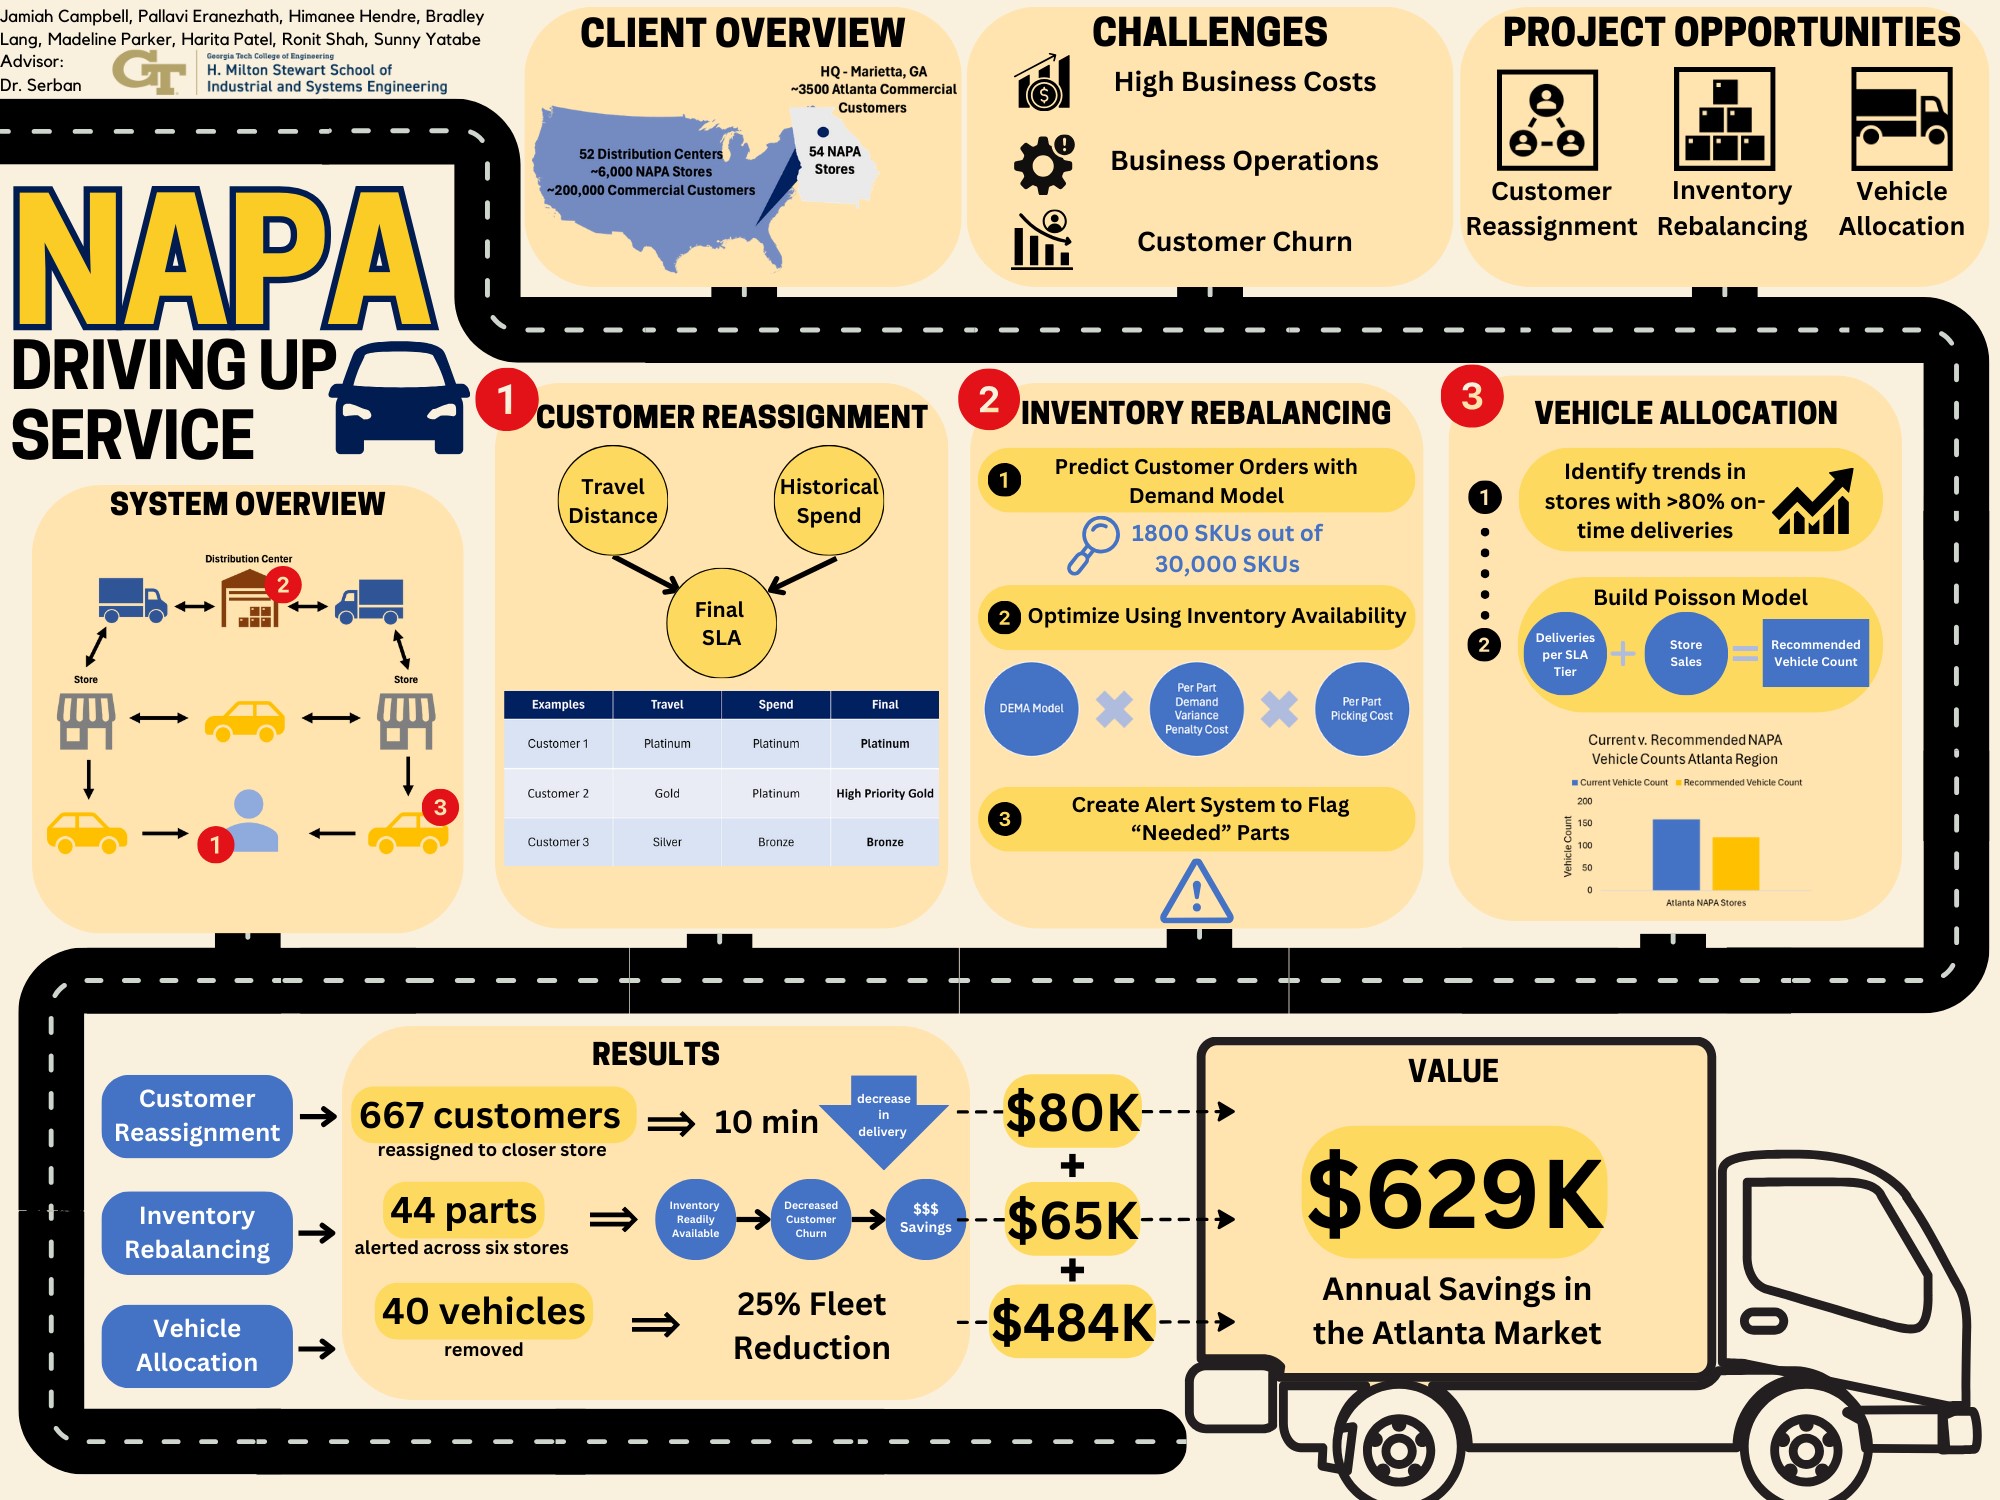
Headquartered in Norcross, Georgia, National Automotive Part Association (NAPA) is a subsidiary of Genuine Parts Company (GPC) that specializes in the retail and distribution of automotive replacement parts, accessories, tools, and equipment. NAPA serves its commercial and retail customers through a vast network of stores across the United States and Canada. NAPA has over 200,000 commercial customers who contribute to 80% of NAPA’s national annual revenue; around 3,500 of them are in Georgia.
Project Objective
NAPA aims to provide their commercial customers with best-in-class service through fast, efficient, and reliable auto parts delivery while reducing excess costs. Recent findings from customer focus groups show that two of the top three decisions in the customer buying process focused on prioritizing quick, on-time deliveries. NAPA customers require consistent service levels to ensure their business operations experience minimal disruptions. If service levels from NAPA start to decline, customers will take their business to competitors that offer quicker service. NAPA recently implemented a new data collection system and has accumulated three years’ worth of delivery data where they identified that the on-time delivery percentage is lower than desired. The goal of this project was to improve the commercial customer’s overall experience and reduce customer churn by addressing operational issues impacting on-time delivery percentages1.
The team has found three main opportunities to assist NAPA in reducing operational costs and churn by addressing areas impacting on-time deliveries. These opportunities encompass different elements within the delivery process and include customer assignment, inventory on-hand at each store, and the available delivery vehicles.
Design Strategy
Opportunity 1: Customer Reassignment
NAPA has expressed interest in implementing a standardized approach to updating customer assignments to minimize the number of improper assignments and ensure all customers receive the level of service warranted by their spending. The assignment updating process is not conducted on a set schedule, which leads to customers’ assigned SLA tier not accurately reflecting their spending. This, in turn, leads to resources being diverted away from their higher-spending customers. The customer assignment comprises two parts: store assignment and SLA tier assignment. NAPA district sales managers are responsible for establishing new customer accounts for stores within their jurisdiction. Ideally, the NAPA team aims for customers to be assigned to the closest available store; however, this is not always the case as factors including manager relationships and customer preference may influence the sales manager’s final decision. The NAPA team has indicated that they want customers to be assigned to the closest store to help ensure they have access to the quickest deliveries possible. After being assigned to a store, the customer account is handed over to the designated store manager, responsible for assigning an SLA tier. However, SLAs are not always set, leading to unassigned customers defaulting to Bronze-level service despite potentially spending at a level that would warrant a higher tier. Unassigned customers have the potential to remain unassigned for extended periods as the updating process is not standardized across the network and is ad-hoc on a store-by-store basis.
Opportunity 2: Part Reallocation
Across 52 NAPA stores in the state of Georgia, NAPA is responsible for the carrying and sale of an average of 29,540 SKUs per store with smaller stores close to 20,000 and larger stores around 40,000 NAPA parts. Demand is forecasted on a quarterly basis utilizing Manhattan Associates' supply chain management software for each individual store. After this quarterly forecast, the store managers are responsible for reordering parts that have been sold and restocking their shelves. This restocking and reordering can lead to parts being missing and thus resulting in late deliveries for customer orders. When this occurs, a NAPA driver is taken out of service to go retrieve the part from another store or distribution center to then fulfill the customer order. Finally, this disruption in service leads to late deliveries and ultimately an unsatisfied customer, which is where an increase in customer churn begins. To mitigate this issue, the team created a flagging tool that recommends inventory parts to be moved to stores where they are needed based on demand, in hopes of eliminating the issue of parts not being readily available.
Opportunity 3: Vehicle Reallocation
NAPA’s deliveries to their commercial customers utilize NAPA delivery trucks and NAPA delivery drivers. Currently, NAPA employs a simple rule when calculating the number of vehicles to be assigned to a store: Approximate monthly store sales divided by 40,000. From analysis, this rule was represented roughly when comparing the true vehicle count against the rule’s estimated vehicle count. There are, on average, 1.15 more vehicles than what the rule recommends.
There are shortcomings with this methodology. Firstly, the value of 40,000 used in the ratio was chosen by NAPA based on anecdotal evidence. Secondly, the simplicity of this calculation does not consider differing characteristics across stores, such as the daily number of deliveries or varying SLA tier customer composition. The misallocation of vehicles across NAPA’s store network contributes to two key issues.
- If a store has a shortage of vehicles, commercial customer orders may not be fulfilled within the delivery time given by the customer’s SLA tier. In this case, reducing customer churn would be the opportunity.
- If a store has a surplus of vehicles, there is waste. Excess vehicles that sit, unused, in a NAPA store’s parking lot do not add any value. However, these vehicles still cost money to acquire and maintain. In this case, the opportunity is to reduce costs.
To address potential shortages and surpluses, the team created a tool that analyzes the current vehicle count for stores within NAPA’s network and identifies if a store has too many or too few vehicles, and by how much.
Deliverables
Deliverable 1: Customer Reassignment Dashboard
Our first deliverable comprises a Power BI dashboard tailored for NAPA. This dashboard serves as a central hub for NAPA to access and manage essential data regarding customer Service Level Agreement (SLA) assignments, customer reassignments, and customer profits.
NAPA can leverage this view to gain a comprehensive understanding of SLA tier distribution among their customer base and improve how they cater to their priority customers. For implementation, NAPA will have a back-end python script that will produce an Excel file that contains all the customers, their financial information, their new SLAs, their new stores, and more. This file can be uploaded to Power BI which will produce the visuals, or the script can be run directly within Power BI itself.
Deliverable 2: Part Reallocation Dashboard
The next part of our deliverable for NAPA features a Power BI dashboard designed to centralize inventory transfer management information across all NAPA stores. This dashboard is constructed based on the inventory rebalancing model's output.
The dashboard's primary function is to present part transfer recommendations, indicating the movement of inventory from one store to another. It simplifies the process for each store to filter and review transfer recommendations, showing which parts are expected to arrive at their location from other stores and which parts they need to transfer to different stores.
Regarding implementation, this dashboard is connected to excel files that NAPA will be able to reproduce through a back-end Python script. The excel files can then be uploaded to the Power BI dashboard which NAPA is familiar with and will update based on the new weekly recommendations.
Deliverable 3: Vehicle Reallocation Dashboard
The results of the recommended vehicle count model have been converted to a Power BI dashboard.
The focus of this dashboard is to provide a visual representation comparing the current vehicle count at each store with the recommended vehicle count. The dashboard also displays the driver count and the vehicle count by store which helps compare available workforce with vehicle inventory. This Power BI dashboard serves as a valuable tool for decision-makers, enabling them to gauge the alignment between the current and suggested vehicle counts and effectively assess vehicle allocation strategies.
Regarding implementation, this dashboard is connected to excel files that NAPA will be able to reproduce through a back-end Python script. Within the Python script are instructions on how to change parameters to evaluate different scenarios. The excel files can then be uploaded to the Power BI dashboard which NAPA is familiar with and will update ad hoc when they want to reevaluate their fleet.
Value and Impact
Value Metric 1- Customer Reassignment Tool:
1647 customers were reassigned SLAs by validating their distance away from the store as well as historical spending. NAPA will make certain that it can meet delivery expectations by assigning customers realistic delivery times. It also ensures that customers are correctly classified based on their spending data, so NAPA knows which customers to prioritize.
Correctly assigning SLA tiers prevents customer churn and helps NAPA retain customers. There is a 77% correlation between receiving orders late and customer churn for the 201 customers responsible for half of NAPA’s customer churn (Appendix R). The newly promoted customers received their orders at a potentially later time than they should have received, and we can correlate their decreasing sales to the late orders that they were receiving. With the correct SLA tier, customers will have feasible delivery times and will receive their order quicker with their upgraded SLA tier. To calculate the value of correctly labeling customers, the churn for each of the incorrectly labeled customers was determined by finding their decrease in sales. From there, the decrease in sales was multiplied by 77% to identify the churn that is directly related to late orders. Looking at only those 201 customers, NAPA misclassified Bronze, Silver, and Gold customers that should have been classified as Platinum, which resulted in a $46,344 loss of sales in a year. Similarly, because NAPA misclassified customers that should have been classified as Gold, it lost out on $17,675 in sales. Finally, NAPA lost $14,963 in sales because they did not correctly place customers in the Silver SLA tier. In total, NAPA lost $78,983 due to incorrect SLA categorization of customers.
Value Metric 2 - Part Reallocation Tool:
On the average week, the NAPA reallocation tool recommends 44-part movements within our six-store test network given parts that were ordered by the 201 most affected customers. Based on analysis done for the month of September 2023 comparing model recommendations to current NAPA inventory snapshots and realized customer orders, our model reduced part out of stock error by 25.6% on average.
With out-of-stock parts being the leading cause of late orders, the part reallocation deliverable directly correlates in preventing customers from churning sales. As mentioned before, churning is costing NAPA an average of $27,344 of sales in the state of Georgia for customers affected by late orders. Relating this to the amount of this related to late orders and the orders that would have been saved in the part was in stock, an analysis showed that across Georgia, NAPA can save $5,414 on average per month when adapting our part reallocation tool. This figure amounts to over $65,000 in a one-year span.
Value Metric 3 - Vehicle Allocation:
The bulk of the financial impact from the vehicle allocation deliverable comes from an overall reduction in the fleet. NAPA leases their vehicles and can quantify the cost per vehicles as follows:
|
Cost Categories |
Annual Cost |
|
Lease |
$4,980 |
|
Insurance |
$2,340 |
|
Maintenance |
$4,800 |
|
TOTAL |
$12,120 |
At present, leasing costs for NAPA nationally are $31,112,040. The leasing costs in the Atlanta region are $1,939,200. Multiplying the recommended vehicle reductions with the cost of leasing, insurance, and maintenance results in estimated yearly savings in vehicle costs of $7,114,440 nationally and $484,800 in the Atlanta region. Fuel costs were excluded as the vehicles we are reducing are not in use.
To note, these values assume a DoorDash usage for commercial deliveries of 20%. If the DoorDash parameter is changed per NAPA standards, the decrease in NAPA delivery vehicle costs will change.
The other part of the financial impact comes from enabling stores with a shortage of vehicles to now be able to complete deliveries at the on-time standard of 80%. Nationally, for stores with a shortage of vehicles, the financial impact is an increase in revenue of $2,040 per month. This comes from an expected increase in on-time delivery percentage, and, in turn, reduced customer churn.
Project Information
Student Team
Ronit Shah, Jamiah Campbell, Pallavi Eranezhath, Himanee Hendre, Bradley (Will) Lang, Madeline Parker, Harita Patel, Sanjula (Sunny) Yatabe
Faculty Advisor

Faculty Evaluator