Poster
Client Context
Delta’s On-Board Services (OBS) team is responsible for stocking all of the items that Delta requires for its in-flight services, such as snacks and blankets. Delta classifies the items as either asset items, which are stored at ambient temperature, or food items, which are stored as frozen or chilled. Delta stores the product in third-party warehouses, after receiving the products from suppliers, and delivers the product to its airport stations on third-party trucks.
Overall, the global supply chain comprises of seven third-party, regional warehouses. Delta leases space from Kuehne + Nagel (KN) and Americold (AMCO), which are the two warehouses that this project focuses on. KN and AMCO are approximately 10 miles apart and are both less than 10 miles from the Hartsfield-Jackson Atlanta International Airport.
AMCO is located in Lakewood, Georgia, and services 64 airport stations in the Southeast United States. It is a temperature-controlled facility, meaning it holds ambient, refrigerated, and frozen items, which require the use of multi-temperature trucks in shipments. At a given time, Delta averages 11,187 square feet of usage in AMCO to store 839 pallets.
KN is located in Forest Park, Georgia, and services Hartsfield-Jackson, as well as 71 other airport stations located in Central America, South America, and the Caribbean. Unlike AMCO, KN holds only asset products and ships out the asset products in ambient temperature trucks. Delta is currently paying for 236,000 square feet (49.8%) out of the warehouse’s total 474,000 square feet and only utilizes 79,060 square feet (16.7%) for product storage.
Project Objective
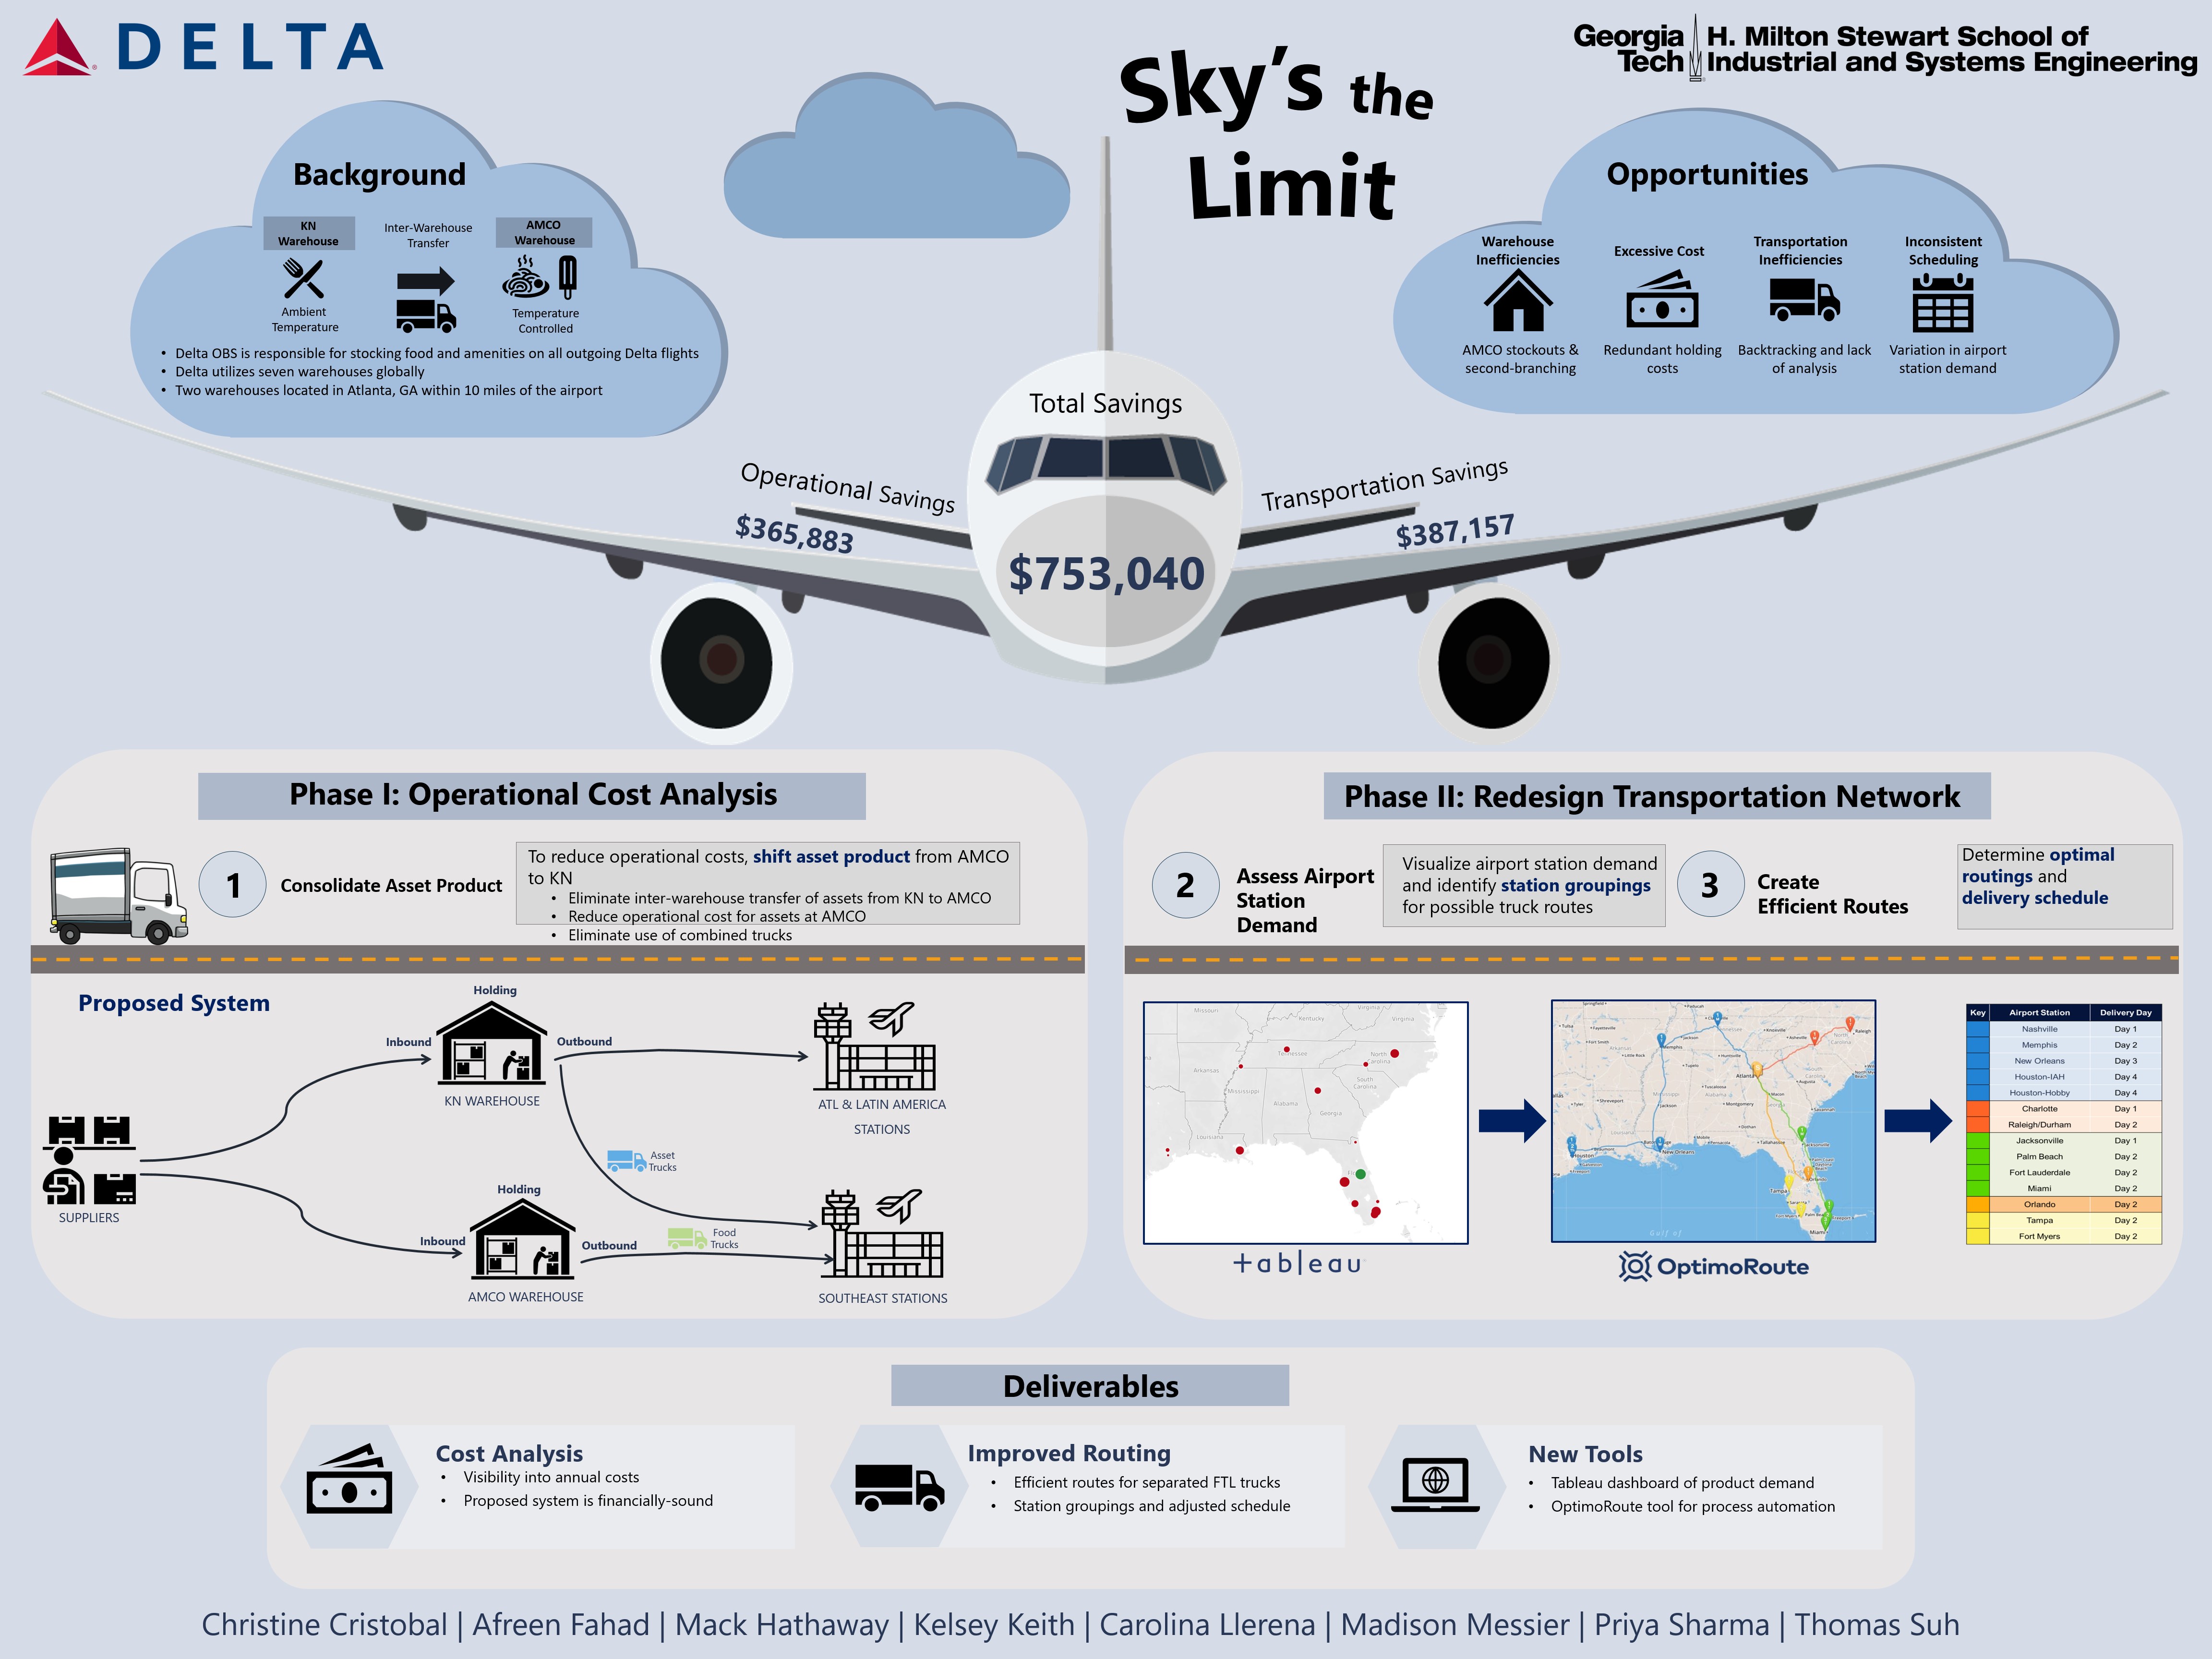
Currently, there is an inter-warehouse transfer (IWT) route between KN and AMCO in which AMCO receives 95.6% of its asset products from KN. The IWT is associated with excess costs and various operational difficulties for Delta. OBS has identified an opportunity to eliminate the IWT between KN and AMCO and consolidate all asset products in KN. AMCO would be the sole supplier of food products in the region, and KN would be the sole supplier of assets. With the shift of asset products from AMCO to KN, there is an opportunity to redesign the truck routes within the Southeastern transportation network by using dedicated asset trucks and dedicated food trucks from KN and AMCO, respectively. The opportunities identified are the following:
1. Eliminate Warehouse Inefficiencies - Since AMCO heavily relies on the IWT to receive asset products from KN, it often cannot fulfill the orders received from airport stations. This is referred to as a stockout. The stockouts result in expedited shipments from other warehouses to receive the product in a process called second-branching. In our analysis, we found that AMCO second-branches 11% of their orders and KN fulfills 60% of these orders.
2. Excessive Cost - Since AMCO is a multi-temperature warehouse, the storage and transportation of asset items from this facility is more expensive than for a single temperature warehouse, such as KN, based on the rates specified in their respective contracts. Additionally, because 95.6% of asset items at AMCO originate from KN, Delta is paying two holding costs for each of these asset items.
3. Transportation Network Design - The combined trucks leaving AMCO have many inefficiencies related to the bulkheads that separate the different temperature products. The chilled and frozen product is located behind the ambient temperature product on these trucks. To access these products, the driver must unload all of the ambient temperature products first. If there is not enough space at the airport station dock to unload the ambient temperature product and reach the chilled or frozen product, the trucks have to continue to the next stop. The trucks then come back to the previous docks on the route in a process known as backtracking. Backtracking incurs extra costs due to the additional time and stop-off fees.
4. Truck Utilization - The results of our analysis found that combined trucks delivering to a single airport station, other than Atlanta, are filled up, on average, up to 45.1%. The current, low utilization of trucks gives us the opportunity to increase utilization with new routes.
5. Scheduling - Currently, Delta manually schedules routes for combined trucks on a daily basis. This process is tedious and inefficient since there are no optimization elements taking into account the combination of both the geographic location and demand of the airport stations on these routes.
Design Strategy
The overall objective of our project was to reduce net cost, while maintaining and potentially improving performance, through the following proposed changes to the operational and transportation networks. The project was divided into three phases that took into account multiple constraints. The first phase involved a cost analysis of the current system. The second phase involved a cost analysis to determine if the operation focused system was an improvement from the current system. The third phase focused on reducing transportation costs for the final proposed system through new routes and schedules for the separate asset and food trucks originating from KN and AMCO.
1. Current System Cost Analysis - The first phase of our project was to evaluate the costs associated with the current system by calculating the annual costs of asset products at each stage of the supply chain, from the supplier to the airport stations. The total cost Delta incurs for the current system every year is $4.4M.
2. Operation Focused System Cost Analysis - The second phase of our project focused on reducing costs by proposing an operation focused system, with KN as the sole supplier of assets and AMCO as the sole supplier of food to the Southeastern airport stations. In the operation focused system, by storing all assets at KN, Delta will not have to pay inbound, holding, and outbound costs for asset products at AMCO. This system also eliminates the cost associated with the IWT between KN and AMCO. In this system, Delta would have an operational cost savings of $365,883 every year.
Next, we calculated a baseline for how the overall cost of transportation would change if Delta shifted the current transportation operations to the new system. In total, we calculated the additional trucking expense Delta would incur by simply shifting its current transportation operations to be $479,528. This showed that the increase in transportation costs outweighed the savings in operational costs for this baseline, which gave us the opportunity to reduce transportation costs by optimizing the transportation network.
3. Inventory Modeling - The OBS team provided us with an inventory analysis tool to determine if KN would be able to store any extra asset product volume for the Southeastern airport stations, currently being serviced by AMCO. Since 238 of the 249 asset items held at AMCO originate from KN, AMCO only sources 11 items directly from suppliers. If AMCO no longer holds asset products, these items are the only ones that would need to be rerouted from the supplier to KN. The additional space needed at KN would be 94 cubic feet. With the increased demand for asset products at KN, the increased inventory would create a smoother demand and faster turn time for these items, decreasing the days on hand for these items by 2 days.
4. Demand Modeling - To visualize station demand, we created a static Tableau dashboard map where the size of the marker corresponds to the demand of the airport station and the color corresponds to the percentage of a truck being filled up. The results show that every station, except Atlanta and Orlando, are highlighted in red, meaning that a majority of the trucks shipped are significantly less than half full.
5. Route Optimization Tool - We selected a commercial tool called OptimoRoute that uses a multi-objective optimization problem to create routes based on minimizing a combination of distance, travel time, and the number of trucks used. In the current system, each truck is only assigned at most 2 stations on each route. However, the results of the tool showed that grouping more stations on each route does not violate any constraints. The optimal routes calculated by the tool for each quarter grouped up to 5 FTL-Asset stations on a single route. Additionally, up to 6 FTL-Food stations are grouped on a single route with food deliveries made within 3 days, so that it does not spoil. Overall, the new routes reduce the number of trucks needed to shift all product while improving truck utilization.
6. Adjusted Scheduling - The groupings of airport stations, provided by the tool, served as a baseline to redesign the delivery schedule. Each airport station within a grouping would have an adjusted order day, pick up day, and a delivery day providing Delta with a more structured outbound schedule for FTL-Asset routes and FTL-Food routes. The team identified the stations that are not receiving their orders on the correct scheduled day for over 20% of their orders so that Delta can work with those airport stations to better adhere to the new schedule.
Deliverables
The deliverables given to the client were the following.
1. Cost Analysis - The cost analysis will give Delta more visibility into the current system’s annual operational and transportation costs compared to the proposed system to justify quantifiable savings.
2. Tableau Dashboard - The Tableau dashboard serves as a visualization of historical airport station demand displaying how empty trucks have been leaving the warehouses and the opportunities available to optimize truck utilization.
3. New Routes/Station Groupings - New station groups and routes originating from KN and AMCO were created using the OptimoRoute tool to minimize cost, distance, and number of trucks used.
4. New Delivery Schedule - A new schedule was created to easily implement the new routes by aligning the order days and delivery days for all stations in the same grouping which allows all shipments in the same group to leave the warehouses on the same truck.
In implementation, the first recommendation for Delta is to improve its daily process in sending outbound shipments. The first step would be to turn the Tableau dashboard deliverable into a live updated dashboard, that is connected to Delta’s database for station orders, in order to visualize updated station demand. Based on the live station demand, Delta can use the route optimization tool, OptimoRoute, to create optimized routes for that specific day’s demand through the automated process.
Because the frequency of deliveries cannot be reduced and storage space of an airport station cannot be increased, FTL-Food trucks would still be shipping out with low utilization. There are very limited options for LTL trucks that are also temperature-controlled, however, Delta could ship products on Delta planes already heading to their destination airport station in a process known as 3DD, or third party drop. This process would allow products to arrive quickly without the hassle of sending a mostly empty truck. Delta has the opportunity in the future to look into negotiating with other 3DD vendors that will be able to produce temperature logs.
The final recommendation for Delta would be to consolidate its Southeastern operations into a single refrigerated warehouse. Ideally, this warehouse would have the temperature capabilities of AMCO and the reliability and scale of KN. If such a warehouse were to be procured at a reasonable rate and could be relied upon to meet Delta’s expectations, the operational benefits and potential savings provided by such a warehouse should be reassessed.
Project Information
Student Team
Christine Cristobal, Afreen Fahad, Mack Hathaway, Kelsey Keith, Carolina Llerena, Madison Messier, Priya Sharma, Thomas Suh
Faculty Advisor

Faculty Evaluator