Client Context
Our client is Cox Communications, who provides cable television, internet, phone, and home automation services in the United States and has been in operation for nearly 60 years. The focus of our project was with the Materials Planning Team of Cox’s supply chain division. The Materials Planning Team works at a corporate level to provide items necessary for the upkeep and expansion of Cox’s cable and internet networks. The team is divided into two sub-teams of planners, which have minimal interaction as they service different projects.
Project Objective
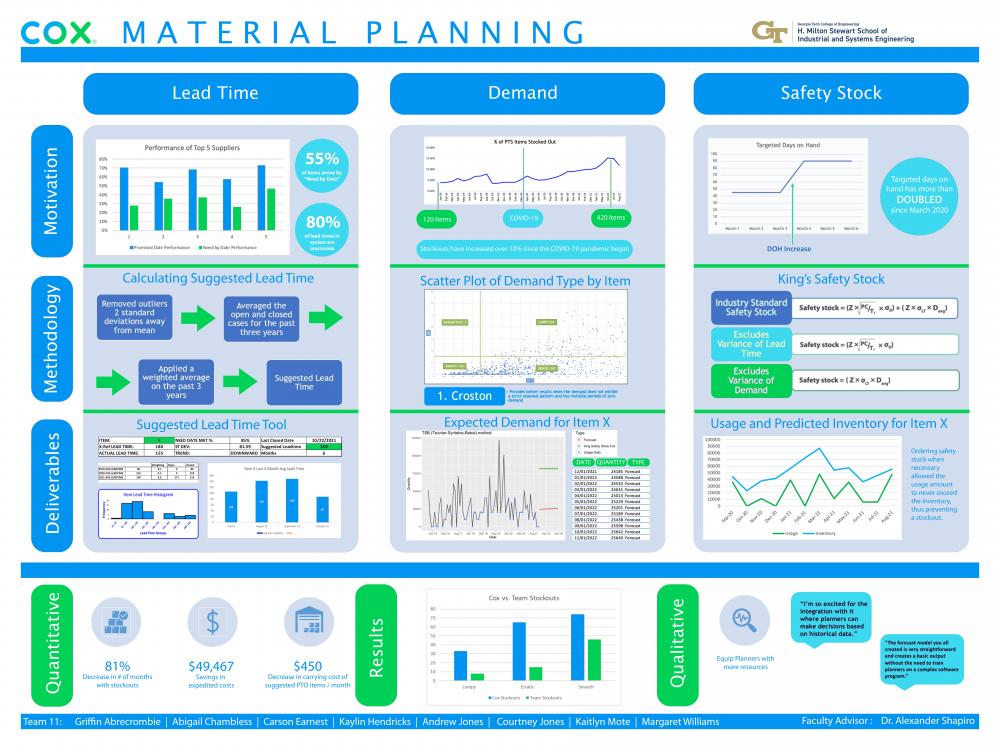
Cox has been experiencing an increase in stockouts since February 2020. This causes increased costs due to expediting items and project delays. One of the reasons for these stock outs were incorrect and even missing supplier lead time in Cox’s database. By fixing the lead times in the database, the Cox planners were able to know how much time to give suppliers for the items to arrive on time. There were also opportunities for improvement in demand forecasting and safety stock calculations. These give planners the knowledge of how much of the items should be ordered and a buffer to reduce stock outs as well.
Design Strategy
Lead Time: Lead times were estimated from historical lead time data by Cook’s Distance and the Exponential Weighted Moving Average (EWMA) method. Cook’s Distance removed outliers found in the data, which protects against over and underestimation. The EWMA method weighs more recent lead times more heavily than less recent, to account for changes in supplier service such as COVID-19.
Demand: The team initially tested traditional demand forecasting methods, such as simple and double exponential smoothing, ARIMA, and naïve methods. These resulted in large confidence intervals and poor accuracy percentages. The team conducted research and determined these inaccuracies were likely due to the high variability in demand amounts each month. This was confirmed by the strategy of Demand Categorization, which divides usage time series into quadrants based on two axes of variation. The first is variability in the timing of periods with zero usage, and the second is in the variability in nonzero usage quantity. The team continued research and found a set of forecasting methods that are intended for demand with variability in timing and quantity, which are Croston’s method and its variations. The team also implemented the Random Forest technique for forecasting, which is an ensemble-based machine learning method that creates many decision trees by which data is classified, to create forecasts.
These forecasting methods were validated by accuracy, which is determined by the formula (1 – MAPE). MAPE stands for Mean Absolute Percentage Error and is a common measure of prediction error. The historical data the planners currently use to forecast is the average of the last four months, the current month last year. The team was unable to compare our forecasts to previous forecasts made by the client. However, due to the lack of autocorrelation found in the data, it is likely that the team’s forecasts are more accurate. 10% of items had accuracy greater than 50% using Croston’s method or variations.
Safety Stock: Since forecasts are never entirely accurate, it is essential to include a safety stock number to prevent stockouts. Due to the team’s statistical analysis of the lead time and demand data, we were able to implement three safety stock equations to replace the current method of increasing the number of targeted Days on Hand to keep in stock. The first equation incorporates both the variability in demand and lead time. The second and third equations omit the lead time and demand variability respectively.
Deliverables
Suggested Lead Time Tool: To solve the issue of incorrect or missing lead times in the client database, the team built a refreshable tool in Excel that estimates actual lead times at an item level and provides planners with metrics and visualizations to aid in decision making.
Demand Classification, Forecasting, and Safety Stock: Two R scripts were created and provided to the client that performs demand classification and outputs forecasts according to the selected demand type. The first R script exports statistics, forecasts and visualized data for a single item and location time series into Excel. The second R script exports a table into Excel containing statistics and forecasts for all imported usage data, which is chosen and pulled from the client’s database by the planners. Both of these solve the problem of predicting future month demand using all available historical item usage data. They also include safety stock formulas for the planner to utilize when ordering materials.
Random Forest: A Python script was provided to the client that takes in historical usage data at an item and location level and generates demand predictions for the next 6 months and an error value that can be compared to demand classification methods. The random forest model generates more accurate predictions for a number of items than demand classification methods and can be used together with the other deliverables to predict future month demand.
ABC Classification: An Excel tool was provided to the client where the client will be able to choose a service level associated with each ABC classification letter. The client can also alter the percentages that customize the ABC item classification levels. This tool provides the client with the statistics required to implement a safety stock calculation that considers both lead time and demand variability.


