Poster
Client Context
Client
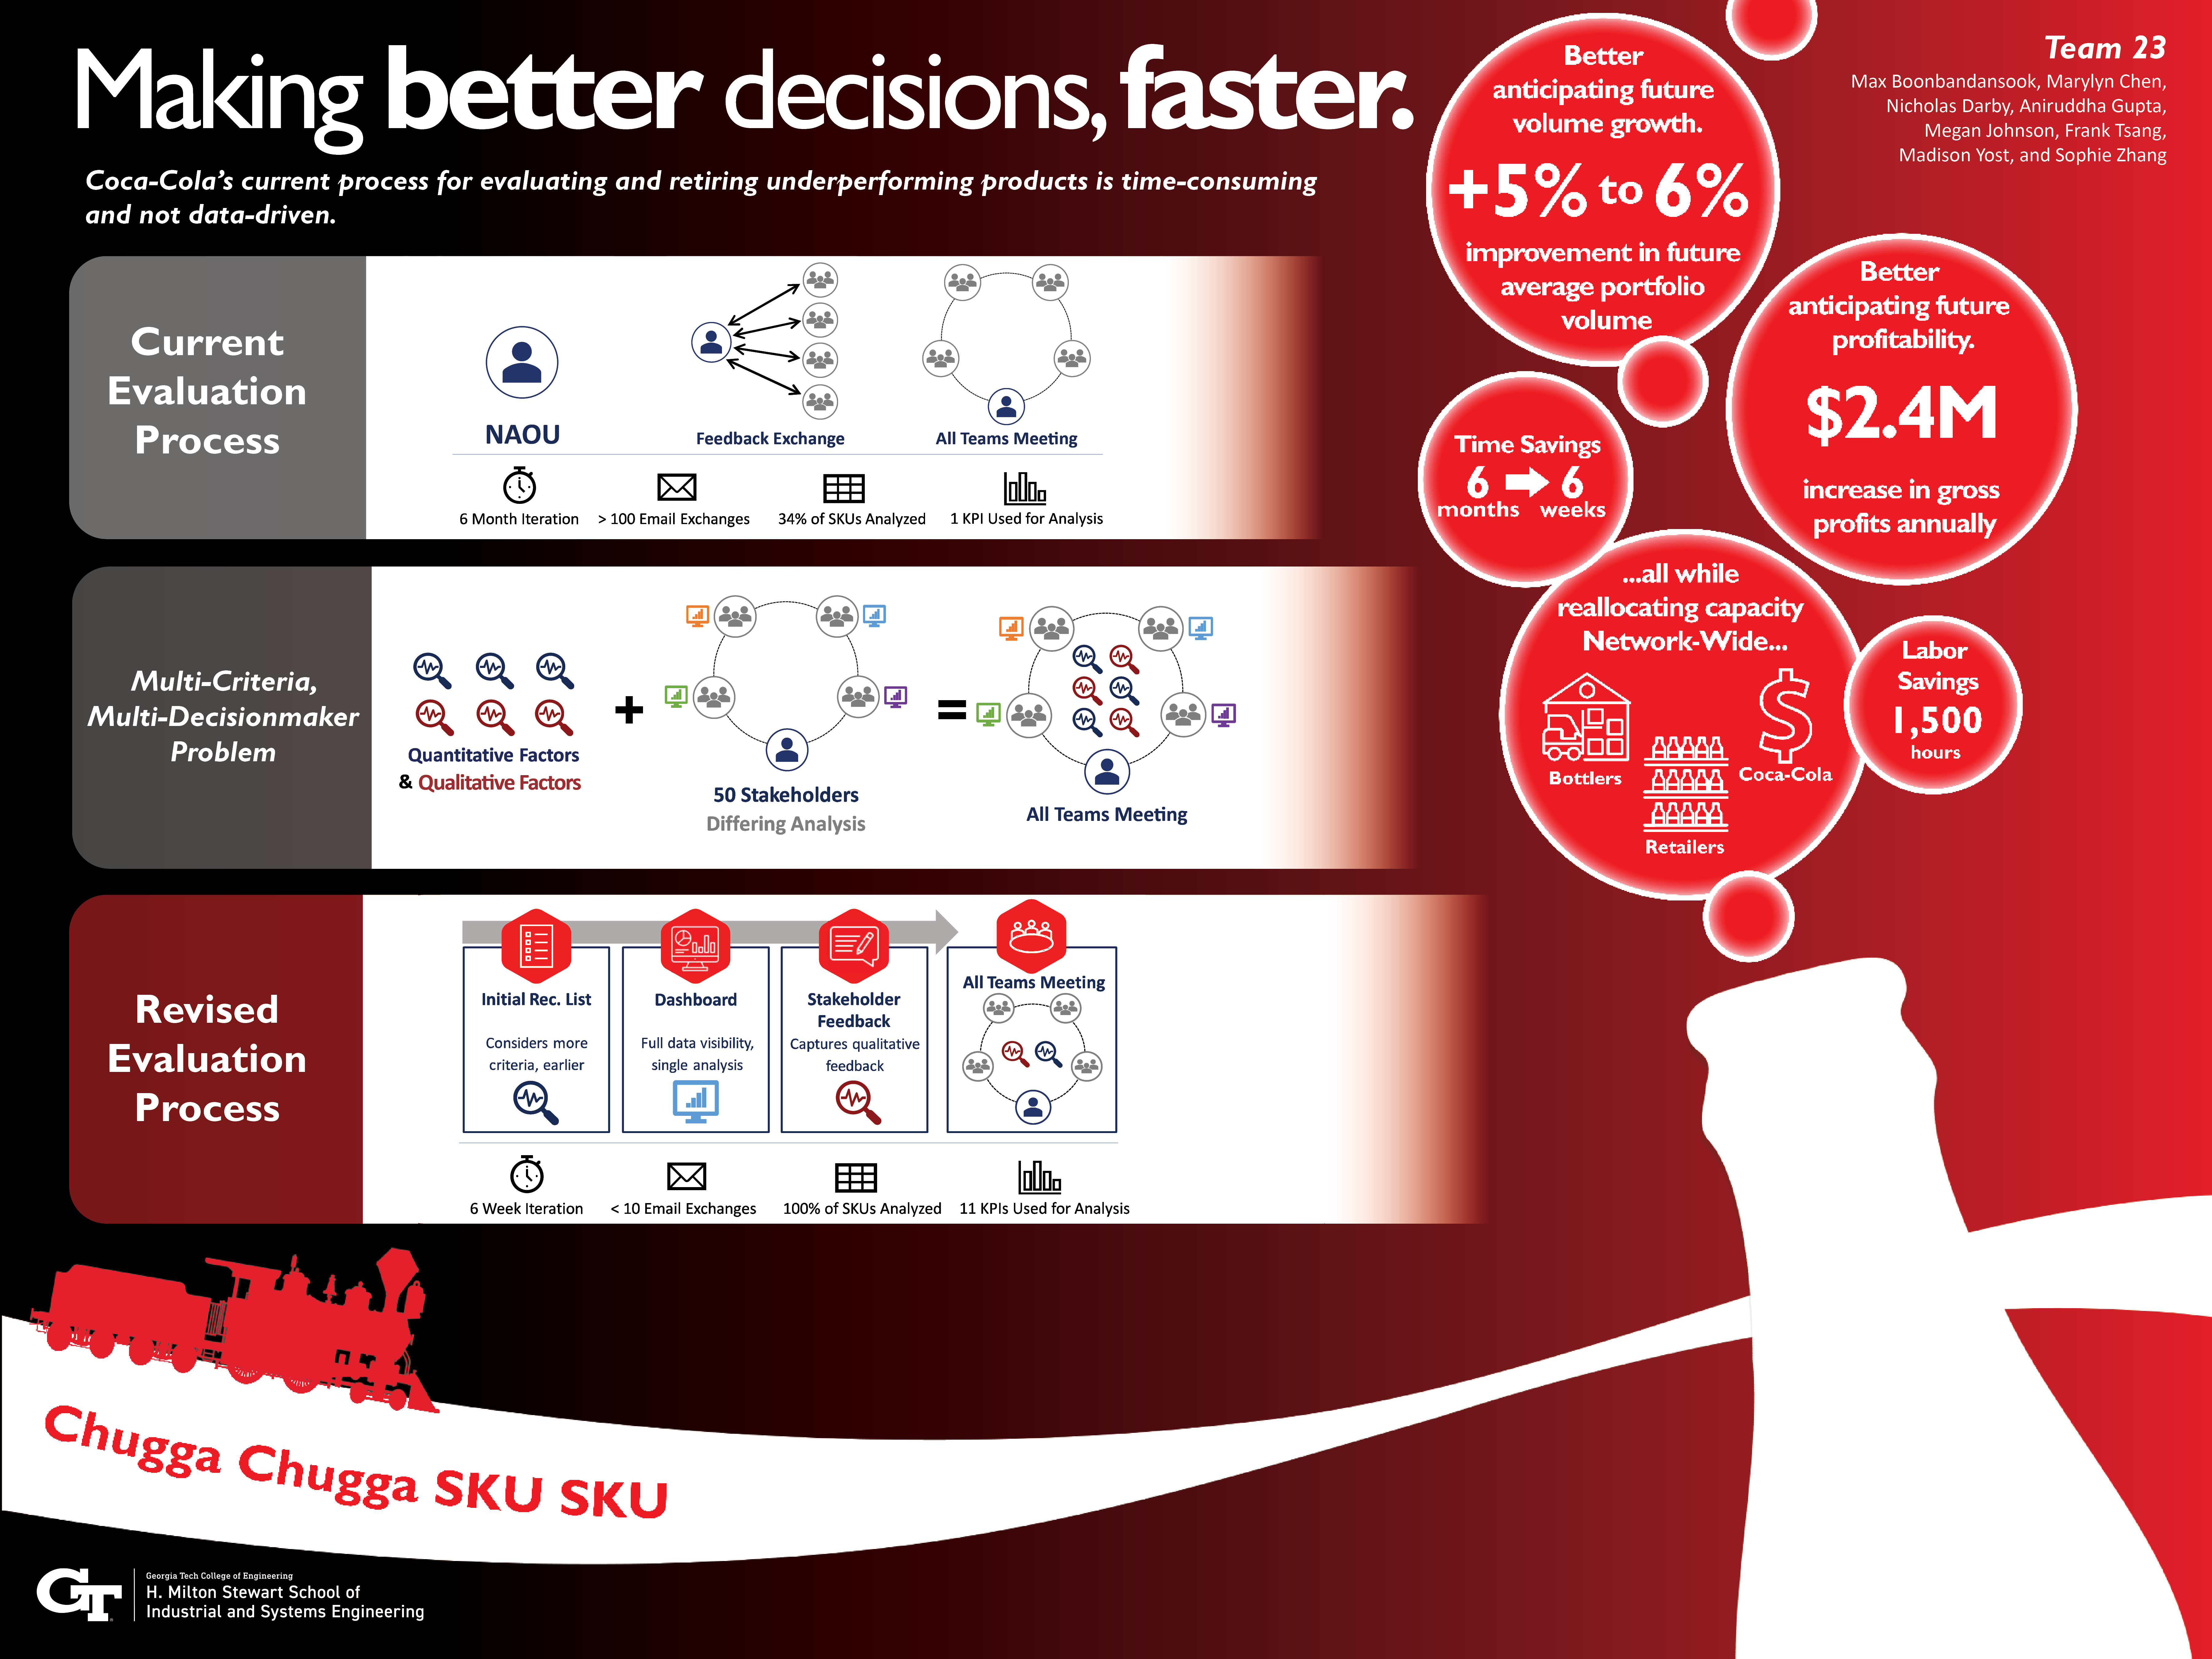
The client is Coca-Cola's North America Operating Unit (NAOU), which is responsible for innovation, commercialization, operations, and supply chain management for the Coca-Cola Company in North America. As part of their role, the NAOU team evaluates the product portfolio annually to determine which Stock-Keeping Units (SKUs) should be retired. The portfolio evaluation process identifies and retires underperforming SKUs to 1) reallocate that SKU’s resources to better performing SKUs 2) provide capacity for innovation and 3) to align the overall portfolio with consumer trends and the brand’s strategy. The challenge with the evaluation process is that it must consider many criteria in addition to feedback from 50 stakeholders with unique objectives. The client requested a redesigned process that is less time-consuming, and more data driven.
Current System
Coca-Cola currently evaluates their portfolio once per year in a six-month long process. The evaluation cycle begins with the process manager sourcing, cleaning, and compiling the past year’s volume data for the portfolio. From there, they identify SKUs that comprise the bottom 1% volume tail. Typically, the SKUs in the bottom 1% volume tail make up around 34% of the total portfolio. Those SKUs are added to an Excel sheet that is shared via email to approximately 50 stakeholders. These stakeholders include representatives from Coca-Cola's Brand Finance, Category Commercialization, and Commercial Operations teams as well as external stakeholders such as the bottlers and large customers. These stakeholders complete individual analyses on the SKUs they are responsible for and provide feedback to the process manager. From there, the process manager compiles the feedback and prepares for an All Teams Meeting where the NAOU and stakeholders meet to make final retirement decisions. Once the decisions are made, the Activation Team begins the retirement of the SKUs and retires them from the portfolio.
Project Objective
Project Objective
Determining which SKUs to remove from the portfolio is a multi-criteria, multi-decision maker problem. The evaluation must consider financial impacts to the company, the SKU’s health metrics, the brand’s strategy, the SKU’s importance to customers, and the opinions of all stakeholders involved. Of their 1200 SKUs, Coca-Cola retires about 200 SKUs per year on average.
The client’s primary concern is the time needed for each evaluation cycle. The current process takes six months. It involves time-consuming, manual data analysis and has delays due to email exchanges between stakeholders. The process begins in April, but a decision is not made until September at which point the static data being analyzed from April is outdated. Furthermore, the long evaluation cycle means that it is only completed once per year. The client wants to evaluate the portfolio more regularly to keep the portfolio lean and aligned with current market trends.
The second concern is with the quality of decision-making. A retirement decision impacts not only Coca-Cola the company, but also the bottlers, merchandisers, customers, and consumers so it is important for the decision-makers to be well-informed. The current analysis, beyond the initial volume filter, is limited to 34% of the portfolio. This method fails to consider SKUs that are overall declining or unprofitable but have yet to fall below the initial cut’s threshold. Furthermore, the NAOU could better utilize data by looking at more Key Performance Indicators (KPIs) in the data like regionality, profitability or continuous growth to make better retirement decisions.
The redesigned SKU evaluation process will reduce the evaluation cycle time to an estimated 6 weeks while automating a more thorough data analysis with visualizations to provide stakeholders a clear picture of the SKUs’ health. This will better inform the decision making in a faster evaluation.
Design Strategy
Design Strategy
The new process design involves three steps. The first is an Initial Recommendation List Application which takes in data and parameters, evaluates SKUs based on 11 KPIs, scores and ranks these SKUs, and generates an initial list of SKUs recommended for retirement. The second step takes the output from the Initial Recommendation List and generates a Dashboard that visualizes the data in an interactive report which stakeholders use to understand SKUs’ health. The final step is a Stakeholder Feedback Form which is linked in the Dashboard. The form collects stakeholders’ scores and comments for each SKU and analyses the scores to determine which SKUs need to be retired, kept, or reviewed at the All Teams Meeting. These three steps are designed to prevent the loudest voice at the All Teams Meeting from having the most influence over retirement decisions. This ensures a balance of power between the retirement process owners, the NAOU, and the brand and SKU owners, the stakeholders.
Validation
Prediction Improvement: One method used to verify the accuracy of the Initial Recommendation List was to apply the model to a historical dataset and see how many SKUs retired by stakeholders in the current process were recommended in the new model’s initial list. The analysis showed that 48.15% of the SKUs recommended by the new model in 2020 were retired under the current process by the end of 2022, while only 38.34% of the 2020 bottom 1% volume tail was retired. In other words, the new model’s prediction accuracy was 9.81% higher. The new model is a better predicter of what SKUs were actually selected for retirement by stakeholders and is better able to anticipate the future underperformance of SKUs.
Volume Change: The team also examined the average growth in future portfolio volume for both the old and new system’s initial recommendations, assuming all recommended retirements were made. In this scenario, implementing the bottom 1% volume tail recommendation from 2020 would have increased the average volume growth of the portfolio by 1.24% and 2.02% in 2021 and 2022 respectively. Meanwhile, implementing the new model’s Initial Recommendation List would have increased average volume growth by 5.95% in 2021 and 6.07% in 2022. This indicates that the new model is more effective at anticipating the future volume growth of SKUs and identifying SKUs that have or will have stagnated in terms of falling growth in future years.
Gross Profit Margin: To address profitability, the team determined whether the new Initial Recommendation List identifies less profitable SKUs by looking at the average gross profit margin of the portfolio. Based on the analysis, the average gross profit margin of SKUs that fell in the bottom 1% in 2020 but were not retired were 0.31% and 2.33% below the portfolio average in 2021 and 2022 respectively. Meanwhile, for the Initial Recommendation List, the recommended average was 1.34% and 2.86% below the portfolio for 2021 and 2022. This shows that the new model better identifies SKUs that will be less profitable in the future and, thus, is better able to anticipate SKUs that will negatively impact Coca-Cola’s portfolio profitability.
Deliverables
Deliverables
Initial Recommendation List Application: The Initial Recommendation List Application reads raw data sets, scores SKUs based on their KPIs, and generates an initial list of SKUs to consider for retirement. The process manager interacts with the Initial Recommendation List through a Graphical User Interface (GUI) that outlines the steps to generate the list. First, the process manager enters the parameters for the data sets being analyzed, the actual data sets themselves, and the final number of SKUs they desire to be returned. Next, they update the default KPI weights and thresholds that affect scoring if necessary. Then they set the category specific thresholds. Finally, they click the “Generate Initial List” button, which populates an Excel file with the desired number of recommended SKUs.
Dashboard: The Dashboard takes the output from the Initial Recommendation List and visualizes the data for stakeholders to use for their feedback. It eliminates the need for stakeholders to individually analyze the data and provides one central location via Power BI for everyone to access. There are two views: a Portfolio View and a SKU Specific View. The stakeholder will open the Power BI report provided by the process manager where they can see a broad view of the portfolio and narrow their search to the SKUs they are responsible for reviewing. After analyzing the data and data visualizations, they can click the embedded link that takes them to the Stakeholder Feedback Form where they provide their score and comments for each SKU.
The Stakeholder Feedback Form & Analysis: Stakeholders will filter the SKUs in their category, provide a score of 1-5, and give reasoning or comments on the score or SKU.
Standard Operating Procedure (SOP): The client will receive two SOP’s: one for the process manager and one for the stakeholders. The SOP documents each step in the process clearly and concisely to mitigate the risk associated with stakeholders leaving Coca-Cola.
Value and Impact
Project Impact
Internal: Coca-Cola
Beyond the cost savings and financial value of the project, there is a much broader impact of the new process for Coca-Cola. The faster evaluation time allows for
multiple evaluations per year to adjust to trends and market changes sooner. As stated by the client, the new process is “dynamic and nimble” so the portfolio can better reflect new trends and strategies. Furthermore, the process supports better informed decisions which will help Coca-Cola meet customer and consumer demands with a healthier, leaner portfolio.
External: Bottlers & Retailers
Bottlers: Bottlers will benefit from better retirement decisions in that the resources currently allocated to underperforming SKUs can be reallocated to better selling SKUs. They will save time and money on reduced changeovers. By producing less unique SKUs, they can lengthen the run times of existing SKUs and reduce the number of machine changeovers. Furthermore, by retiring unhealthy, slow-selling SKUs, Bottlers will not have as many products expiring on the shelf before sale.
Retailers/Merchandisers: Retailers will see less operational complexity since retiring less popular SKUs will result in retailers not having to run discounts to clear these less popular SKUs from their shelves. Further, this will free up “facings,” which are the number of products a customer can see when looking at a shelf. Additional facings can be used for products currently selling out before a restock occurs. Lastly, like Bottlers, Retailers also see reduced number of expirations because slow moving products will be retired and replaced with faster moving products.
Project Value
Non-Financial: In addition to the impacts discussed above, there are other non-financial values to Coca-Cola: hours saved and evaluation cycle time. The new design will save Coca-Cola an estimated 1,506 labor hours which can be reallocated to other responsibilities. One stakeholder told us in a follow-up interview that the new design will cut her evaluation time by 80%. These stakeholder hours come from Coca-Cola directors and brand managers who have significant roles in the company. Freeing time previously wasted in analysis and discussion of trivial SKUs can be better directed to their other projects. Secondly, the new design reduces the evaluation time from 6 months to 6 weeks, a 75% decrease. Both of these time savings are verified by the client who added that they may be conservative estimates.
Financial: The new process design is expected to increase gross profits of the portfolio by 0.46% annually. This increase in profits comes from the improved ability of the new initial list to identify SKUs with future profit and volume growth potential. This 0.46% increase in gross profit is equivalent to $2.4 million in gross profits for 2022.
Client Implementation: The client contact, the process manager, has used the Initial Recommendation List and Dashboard. In summarizing his feedback, he said, “This new process is nimble, dynamic, and light years ahead of where we were at.” Specifically, the process manager noted that the model not only helps identify underperforming SKUs more effectively, but it can also be used to predict future success of SKUs. The team showed the Dashboard and Stakeholder Feedback to stakeholders in follow-up interviews. They were happy that the process is housed in Teams because they don’t have to bookmark a link or worry about excessive email exchanges. One stakeholder said that over the course of the year, the new process will save time by 80% because of the centrally located and preprocessed data. The client has all the deliverables functioning on their computers and is prepared to use the new system in their next evaluation cycle.
Project Information
Student Team
Max Boonbandansook, Marylyn Chen, Nicholas Darby, Aniruddha Gupta, Megan Johnson, Frank Tsang, Madison Yost, and Sophie Zhang
Faculty Advisor

Faculty Evaluator