Poster
Client Context
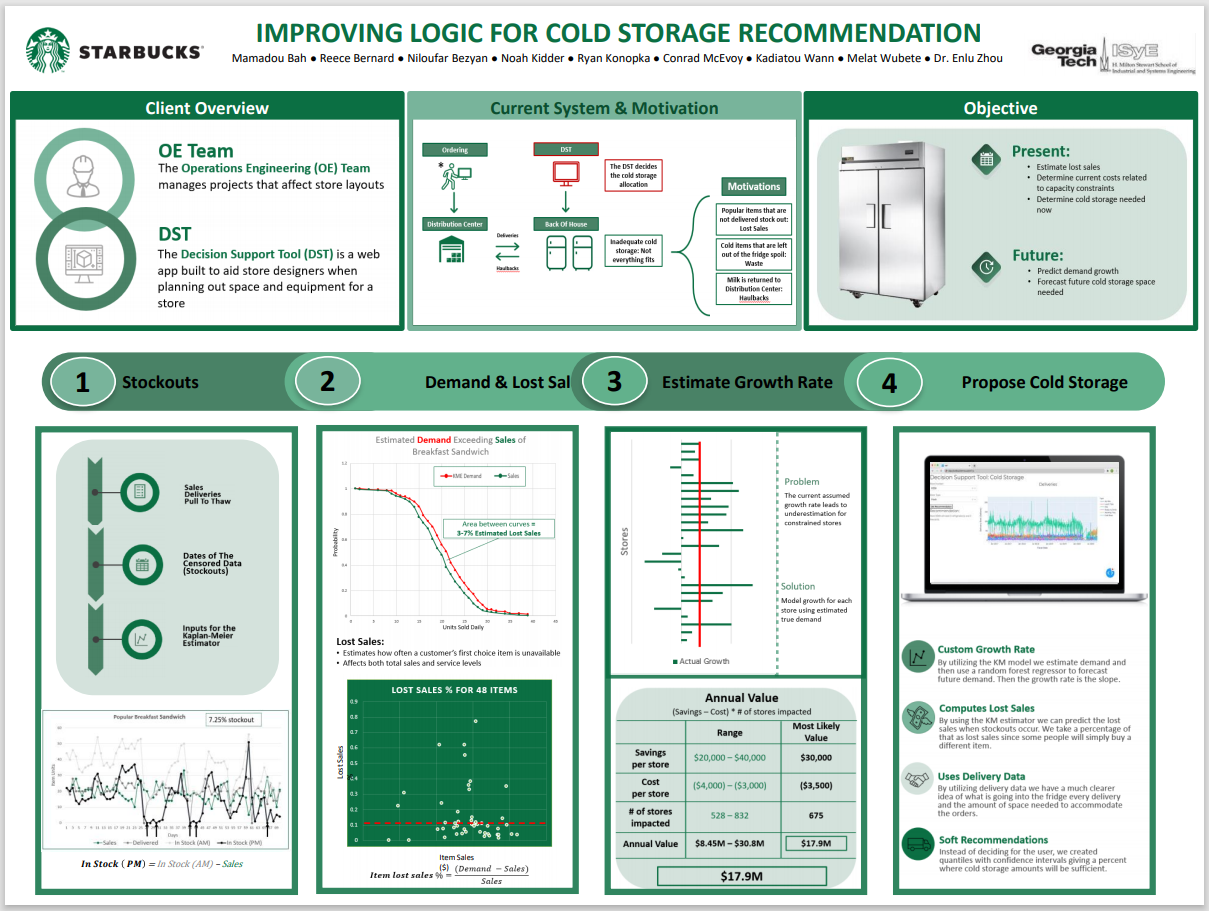
We are working for Starbucks, specifically the Operations Engineering (OE) team. The OE team works with store designers to manage the layout and design of new and renovated stores. They use a web application called the Decision Support Tool (DST) to allocate equipment in their back of house. We are focused on the recommendation for refrigerator and freezer counts.
The DST currently operates by taking in sales data, a constant growth rate, store type, and delivery frequency. The tool then looks at the peak hours of sales and cleanses outliers outside of 2 standard deviations to make a 5-year forecast before outputting overall fridge and freezer counts for a particular store.
Project Objective
Starbucks has estimated that 30-50% of stores are constrained by their cold storage capacity.
Our Back of House project has a present and future objective.
For the present and current operations of a store, we estimate lost sales and determine current costs from lost sales. In addition, we determine the current cold storage needed for stores to identify whether the store's current back of house cold storage capacity is constrained.
The future objective is motivated by the fact Starbucks does not consider their back of house cold storage capacity when renovating their stores, which often leads them to knock down a wall to add space for additional cold storage. Our recommendation tool predicts demand growth for each store and forecasts future cold storage space needed to avoid knocking down walls.
Design Strategy
In order to calculate lost sales and predict cold storage, we first find days of stockout and use them to estimate demand. The demand is then combined with sales data to estimate a store’s lost sales and predict the growth rate, both of which lead to our final proposed cold storage.
Deliverables
Lost Sales Logic:
We have used the Kaplan-Meier estimator to obtain the demand distribution. Next, we have utilized this demand distribution to calculate an item's lost sales percentage. Each lost sale represents an occasion when a customer did not receive their first choice item. According to store manager interviews, for mobile orders, this usually represents true lost sales when demand is not met, meaning Starbucks missed an opportunity to make money and satisfy a customer. For in-store orders, this often represents a customer buying a second-choice item, which is a smaller loss but diminishes service levels and Starbucks' understanding of which items customers would rather see in stock.
DST:
The new DST is a web app that is contained in a .zip file. The user inputs store number and type of store and it utilizes the delivery and KM estimated demand data. The DST recommends the number of doors needed currently and uses a growth rate based on estimated demand to predict the amount of doors needed in 5 years. It outputs the current demand growth and a breakdown of delivered items in order to give a better understanding of what items are taking up the most space.
Project Information
Student Team
Bah, Mamadou
Bernard, Maurice
Bezyan, Niloufar
Kidder, Noah
Konopka, Ryan
McEvoy, Conrad
Wann, Kadiatou
Wubete, Melat
Faculty Advisor

Faculty Evaluator