Poster
Client Context
The Coca-Cola Company is a multinational beverage company that produces and distributes products such as sodas, sports drinks, juices, milks, coffees, and teas. The teams primary contacts are part of the E2E integrated planning team. In order to narrow the scope, the team is looking at Simply brand products and production lines located in the Auburndale, Florida plant.
The supply planning directors use a Llamasoft optimization model in order to create a monthly inventory plan. Results from the model are used to communicate a production plan with the manufacturing team in Auburndale each month. The production planning managers at the plant then produce a weekly plan for the production facility. When the production plan is executed, there actual quantity produced is not always close to the planned quantity.
Project Objective
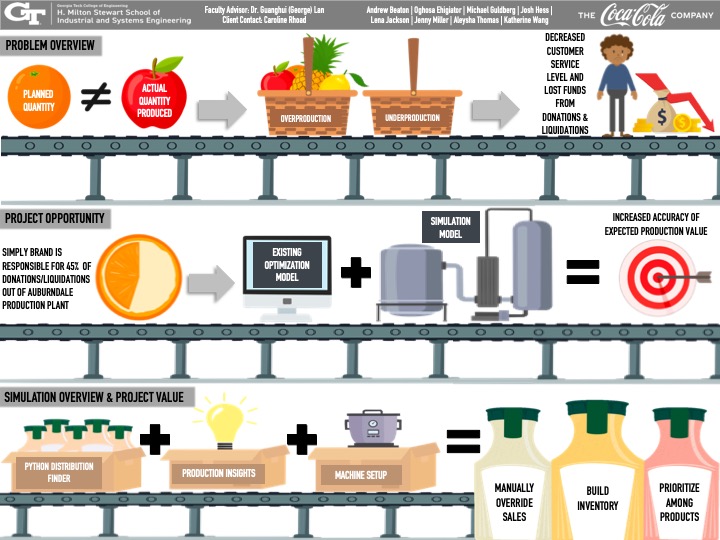
Coca-Cola’s optimization model leaves out steps in the production process, causing uncertainty and miscommunication between the integrated planning team and the outputs of the Auburndale production plant. The model takes in inputs such as demand, costs, and capacity constraints, but does not include inputs such as machine constraints and insights from production.
The main opportunities are reducing underproduction, overproduction, and determining which materials at the plant contribute the most to costs associated with not producing close to the planned quantity.
Design Strategy
The project involved using the historical production data from the Auburndale plant to create a simulation model. This model mimics what happens at the plant after the production plan is executed in order to determine how well the plan will be followed.
The three main objectives of the simulation were to create the cases for each material based on the plan for a year, assign the cases to lines, and to simulate the production of the cases. A “Line” class contained the line number, the total time that a line has for production in a year, a list that stores the number of cases for each material that have been assigned to a line, and the cases for each material that have been produced on a line. A “Material” class contains the material number, the material name, the total number of planned cases to be produced for a material, the total number of cases that have been produced for a material, and the total time spent to produce cases.
The team determined the set of materials that could be run on each line using information given to us by the plant managers as well as historical data. Once the team obtained the options of lines to produce each material, the team then assigned the cases of materials to the line with the most availability. Among the possible lines that a material could be run on, the line that had the fewest materials already assigned to it would be chosen.
Using actual production data from the past three years, the team determined the hours per case produced by line for each material. The team then used Python to fit a distribution for the hours per case based on both the material and the line. The simulation used this distribution to accurately approximate the amount of time to produce each case. The total amount of hours in a year was incremented by the amount of time it took to produce the cases for the line that was used. The production of cases was simulated until the lines had no time left for production.
The team created a risk calculator from the simulation. For each simulation run i, it found the difference between the number of cases produced by simulation run i and the planned quantity for that material from the Llamasoft produced plan. It then finds the mean of over and under production for each material and the overall mean and standard deviation for n runs. Additionally, using constants for loss per case for both over and underproduction given to us by the client, the calculator provides an estimated dollar figure for risk for underproduction, overproduction, and total monetary risk.
Deliverables
Simulation model/risk calculator
The model is built to be delivered as either a ZIP file or as a private GitHub repository. The structure of the model deliverable is intentionally designed so that the user can only interact with one Python file: risk_calculator.py. The model will output the mean overproduction, mean underproduction, standard deviations, and estimate the loss due to both. The model then exports the material-specific over and underproduction averages over ‘n’ simulation runs to a CSV file and prints reporting statistics to the console
Implementation plan
An implementation plan will be used alongside the simulation model. This plan details how to use the simulation model for best results and how to implement at other facilities.
Production line analysis
A file will be given to the client that will tell them which material and which line has the most risk associated with it. Using this analysis, the client now has insights into which lines and materials need to be prioritized when considering the risk of over and under production.
Other recommendations
Recommendations for the client include implementing more constraints into their Llamasoft model based on the real-life production environment and further investigating the SAP master data that is used in the Llamasoft model. An example area of improvement is with the estimated unit capacity calculation for each line.
Project Information
Student Team
Andrew Beaton, Oghosasere Ehigiator, Michael Guldberg, Joshua Hess, Lena Jackson, Jennifer Miller, Aleysha Thomas, Katherine Wang
Faculty Advisor

Faculty Evaluator