Poster
Client Context
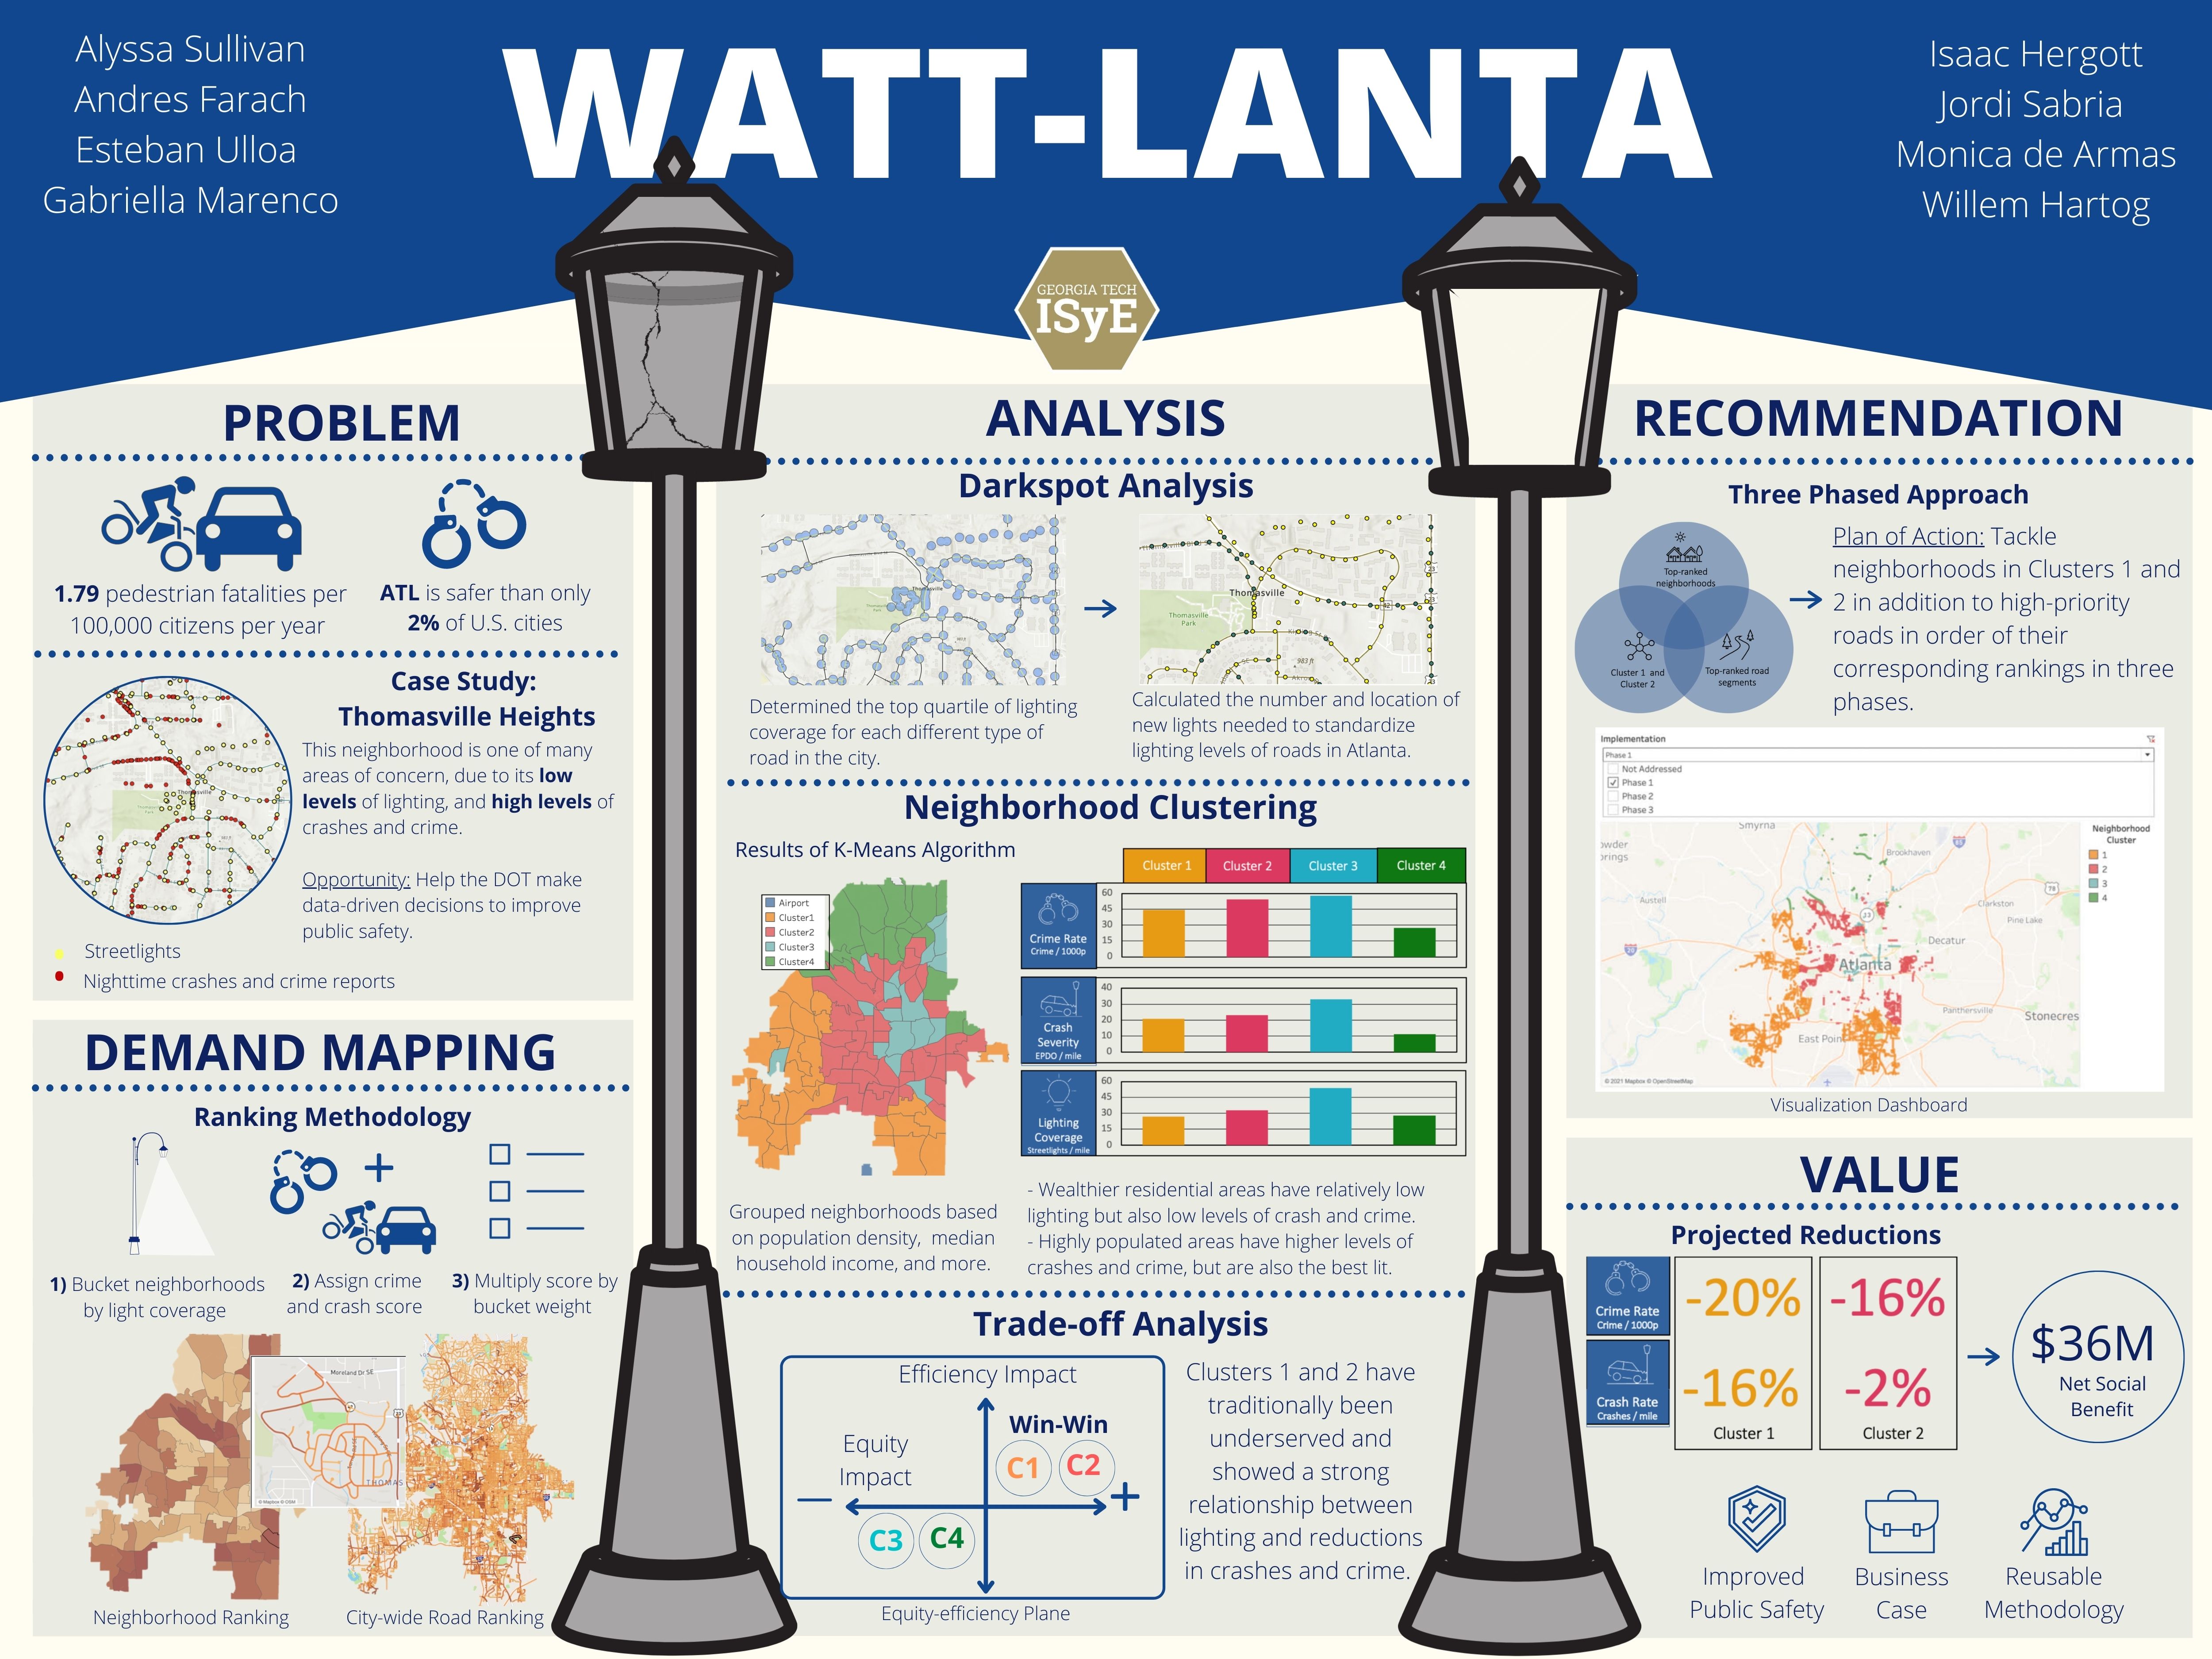
The Atlanta Department of Transportation (ATLDOT) is a government entity that aims to improve the safety, efficiency, and accessibility of the city’s transportation network to provide a better quality of life for the residents of Atlanta. It is tasked with managing and promoting transportation infrastructure, including sidewalks, bike lanes, and streetlights. The DOT’s goal regarding strategic installation of streetlights is to facilitate the efficient flow of traffic and pedestrians, deter crime, and help improve public safety.
Project Objective
The objective of the project is to develop a streetlight footprint expansion plan that maximizes public safety given the DOT’s budget constraints. The team identified two stakeholders in this project: the client and the community. For the client, there is an opportunity to shift the DOT’s streetlight installation process from a reactive to a proactive approach. By identifying areas that are in most need of intervention, we can help the client maximize the impact of a capital project under budget limitations. For the community, there is an opportunity to improve public safety in Atlanta through the installation of new streetlights. Currently, Atlanta is safer than only 2% of US cities based on crime rate, and is also ranked as the 25th deadliest region in the country when it comes to pedestrian fatalities. Many studies in the US have shown a correlation between increased lighting and a reduction in crime and crashes.
Through the efficient allocation of the DOT’s investment in additional lighting, the team can help maximize public safety based on reduction in crime rate and crashes in Atlanta.
Design Strategy
The team started off by creating a prioritization model that aims to identify the neighborhoods and roads with the highest need for streetlights based on three factors of importance to the DOT: crash severity, crime rate, and streetlight coverage. Once these metrics were calculated for each neighborhood and street in Atlanta, the next step was to create a neighborhood and street ranking according to need for additional streetlights. The next component of this model was to estimate the number of additional lights needed to standardize illumination levels of roads in Atlanta. In our dark spot analysis, we determined the amount of additional lights needed to increase the percent lit to a predefined threshold, and created a map with the approximate locations of the new streetlights by going through each dark-spot on a road and progressively adding lights without buffer overlap until the defined illumination-levels were met.
Based on our analysis of the relationship between crashes, crime, and lighting, we found that the impact of additional lighting on public safety is not the same for all neighborhoods. To more accurately assess the impact of geo-demographic factors on the possible benefit of increased lighting, we clustered the neighborhoods using the K-Means Algorithm. We based the clustering on the following attributes: percentage of local and arterial roads, population density, geographic location, and median household income. The results of the clustering allowed us to identify which neighborhoods would respond best to increased lighting.
This led us into the next part of our project: the trade-off analysis. To make recommendations, we considered both equity and efficiency. In terms of equity, it was clear that some of the clusters were in need for more lights than others, but those with characteristics such as high population density and high levels of lighting, as well as those with very low population densities and high median household income would not benefit the most from additional lighting. Our team decided to prioritize neighborhoods in the clusters where additional lighting would have the biggest impact. These neighborhoods have been typically underserved by the government, and share characteristics such as low median household income, low levels of lighting and high levels of crashes and crime. In terms of efficiency, our team performed a cost-benefit analysis for the installation of new lights in each cluster. To calculate cost, our team took into account installation, maintenance and operation for new lights over a designated timespan. The social benefit was calculated from the projected decreases in crashes and crime based on a regression model, and used societal costs for each type of crash and crime to quantify the impact.
Deliverables
Prioritization Model:
There are three deliverables that the DOT will receive to make use of the determined rankings:
Tableau dashboard to help the DOT visualize the implementation phases, zoom into desired neighborhoods for a deeper dive into troubled roads, and overall trace our prioritization methodology. Additionally, the client can utilize features such as cluster profiles and council districts to filter the dashboard with the purpose of tailoring their presentation of the recommendation.
We will also be providing a consolidated list containing all recommended road segments in the order that they should be tackled based on our phased approach. The DOT will use this list to address roads whenever an opportunity to install a small number of lights arises.
Three ArcGIS Map layers: the first indicates the ranking and the estimated quantity of streetlights needed in each road segment, the second layer will include a ranking index and cluster assignment as attributes of the neighborhood data, and the third layer indicates the approximate location of where the new lights should be installed based on our dark spot analysis.
Costing Tool:
This deliverable comes in the form of an Excel workbook. The user inputs the number of lights they want to install, as well as a designated time frame, and the costing tool outputs the net present value of the total cost of implementation. The output takes into account the costs of installation, maintenance, and operation for the given time frame. The malleability of this tool allows the City of Atlanta to adjust specific costs within each of the categories to accommodate for any future changes. The most valuable aspect of this deliverable lies in the DOT’s ability to compare in-house costs to a Georgia Power proposal to install and lease lights.
Project Information
Student Team
Alyssa Sullivan, Andres Farach, Esteban Ulloa , Gabriella Marenco, Isaac Hergott, Jordi Sabria, Monica de Armas, Willem Hartog
Faculty Advisor

Faculty Evaluator