Poster
Client Context
The Atlanta Braves is a baseball team in the Eastern division of Major League Baseball and is one of thirty participating teams, with their fan base being centered in the Southeast United States. The Braves’ Business Intelligence team is sponsoring this project and their main function is steering strategic decision making for stadium operations. Truist Park, a 15-acre complex located in Cobb County, Georgia is home to the Braves. It seats roughly 41,500 fans and hosted 81 games in the 2019 season, bringing in a record revenue of $476M. The rise of COVID-19 in the United States forced many stadium closures in early 2020, including Truist Park. As of December 7th, Georgia had over 483,295 infections and 9,516 deaths. Opening the venue requires extensive caution, as the CDC classifies a large in-person gathering at the highest risk level for virus transmission. A safe reopening can serve as an example for other community mass gatherings and sporting events. Safety protocols and operational procedures must be set to ensure customer health inside the stadium and mitigate any risk to the Atlanta metropolitan area. Effectively managing the customer experience is critical for both the customer health and financial health of the organization, as their baseball operational revenue plummeted 97% this past quarter.
Project Objective
The objective is to mitigate COVID-19 transmission in Truist Park for the 2021 season and enable the best feasible financial position, while keeping customer safety at the forefront of every operational decision. Four opportunities and associated deliverables are highlighted below:
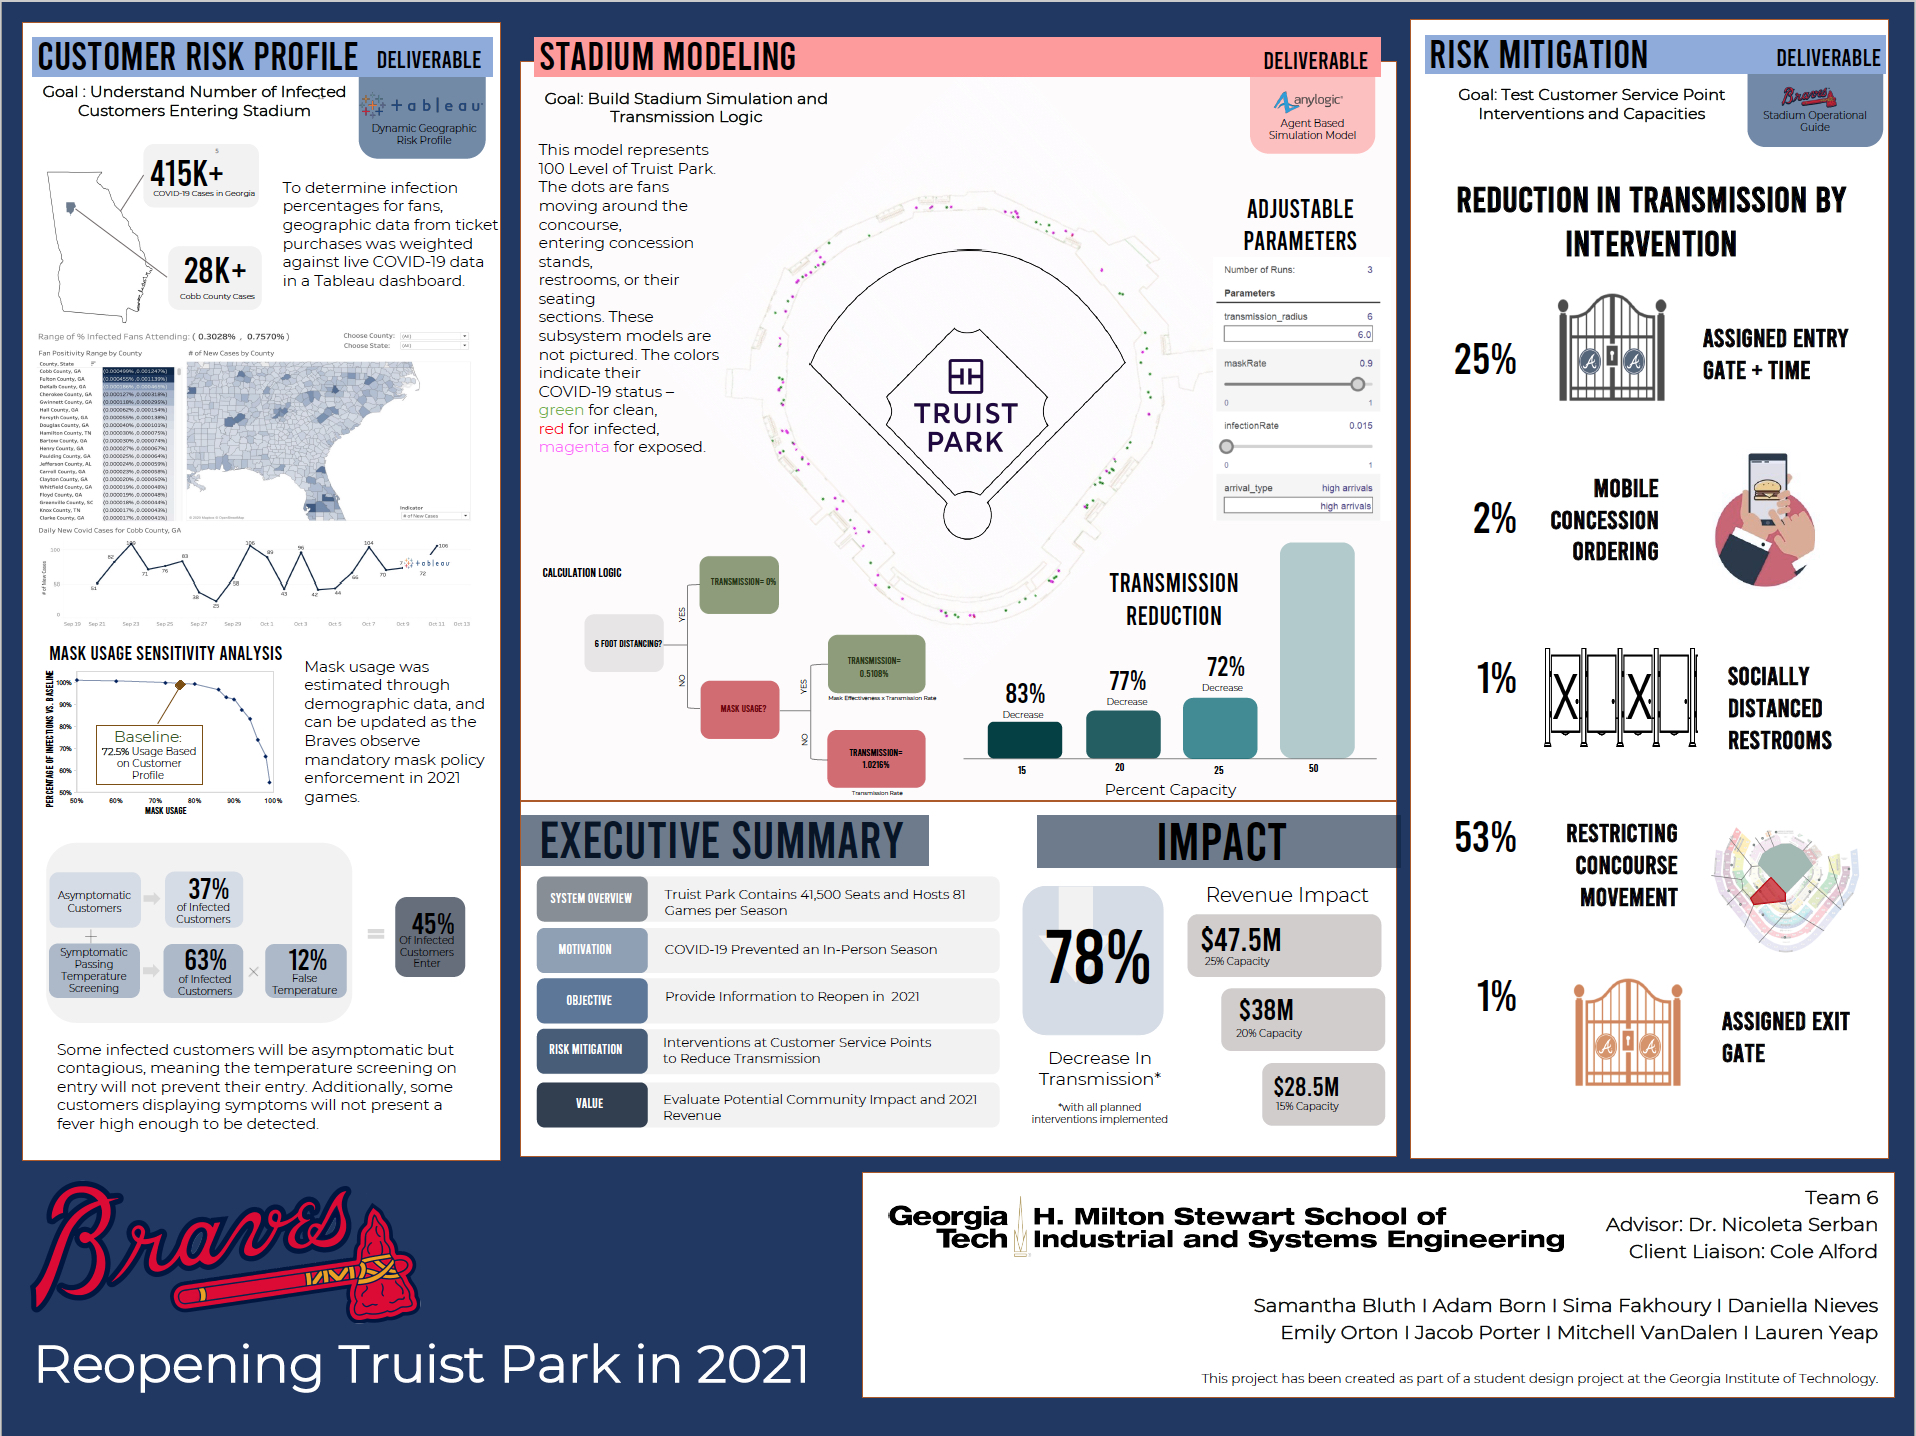
- A customer risk profile in Tableau determines the percentage of infected individuals entering the stadium for any given game and serves as an input to the simulation model.
- An agent-based simulation of the stadium in AnyLogic software records virus transmission between customers as they utilize customer service points: entry, concessions, restrooms, concourses, seating, and exit.
- Risk mitigation interventions limit the number and duration of interactions at different customer service points. Effective interventions at various capacities are recommended in a stadium operational guide for the Braves.
- The impact of these recommendations is evaluated from a health and revenue perspective. Health metrics, including a range of infections, hospitalizations, and deaths are calculated based on the customer age demographic. Additionally, revenue of opening at different operational capacities is provided.
This project quantifies and provides clarity into the reasoning behind the operational decisions that can be carried out at Truist Park. By providing research, COVID-19 metrics, a tailored simulation, and capacity impact assessments, the Braves will be empowered to quantitatively inform decision making on their risks and revenue for the 2021 season and beyond.
Design Strategy
A Tableau dashboard was created using inputs from the New York Times COVID-19 Center and geographic information of 2,777 counties from historical ticket scans. With this data, an approximation of the percentage of infected customers entering the stadium can be collated into an overall ratio, with a high and low estimate to account for variation in source data.
Using live infection estimates, a simulation model was created in AnyLogic to represent customer behavior throughout a baseball game. Observations on customer movement and interactions track total exposure, which is translated into infections and other health metrics to quantify transmission impact. Individual customers are modeled through the built-in pedestrian library and have the ability to enter gates, travel throughout the stadium, use customer service points, and go to their seats. All agents have properties such as age and mask usage and are classified as susceptible or infectious. When infectious agents come near susceptible agents, an event logs their interaction. These events are evaluated at the end of the simulation based on the following transmission modeling.
An exposure is triggered only when a susceptible person comes within 6 feet of an infectious person. If the infectious person does not wear a mask, the likelihood that an exposure leads to an infection is given by the effective transmission rate of 1.02%. If the infected person wears a mask, the effective transmission rate decreases to 0.51%. If a susceptible customer encounters both a masked and unmasked infectious person during a game, the unmasked transmission rate of 1.02% is used. This is a simplified logic based on CDC guidelines. The team originally evaluated a more complex method, which gave more focus to distance, using a function of inverse square of distance and time, by summing the total duration of all engagements with infectious people. However, based on current information, research, and advice from Dr. Serban, our advisor, there was no way to credibly translate this exposure to an infection number.
The simulation represents a customer’s experience in 2021 by incorporating factors within a digital build of Truist Park. The model incorporates easy-to-use parameters to allow the Braves to update and dynamically observe changing situations and risk levels. Among these adjustments include transmission radius, infection rate, arrival type, stadium capacity, and mask usage. Using spreadsheet input, demand rates, service times, section restrictions, and more detail-heavy parameters can be updated. With customers represented by agents, behavior and transmission can be accurately emulated and interventions analytically tested with no financial or health risks for the Braves.
The simulation is designed to test, both independently and combined, intervention strategies for customer service points. All 2021 interventions assume social distancing and customer compliance. Fifty replications were run for each strategy to ensure a reliable 95% confidence interval for outputs. The results of these replications were translated from infections to hospitalizations and deaths using virus specific health calculations.
Deliverables
Deliverables: Customer Risk Profile Dashboard in Tableau, Agent Based Simulation Model in AnyLogic, Stadium Operational Guide
The Customer Risk Profile Dashboard will determine the range of percent of COVID-19 positive individuals that will enter the stadium, which serves as an input to the simulation model. This dashboard has a live connection to the New York Times Covid Tracking Database and will update the percent of positive individuals input as new COVID-19 data is added. This ensures that the most up-to-date percentage is available for use in the model, keeping the model relevant as COVID-19 progresses. In addition to cases, the dashboard provides counts for mortality and hospitalizations so the Braves can stay up to date on how the virus is impacting their fan base.
The AnyLogic simulation will deliver value by ensuring the Braves can continue updating and testing interventions as customer behavior is observed. A separate output of the model also deals with health metrics- specifically hospitalizations and deaths that result from a baseball game. This shows the Braves what impact they are having on surrounding health systems as well.
The stadium operational guide includes how the different customer service points operate based on the results from the simulation model and details our recommendations for how the entry process, concession stands, restrooms, concourse movement, and clubs/suites should operate. This is a deeper dive for the Braves on specific action items based on the methodology from the final report in order to implement interventions and capacities per level and customer service point.
Recommendations:
Various customer service point interventions were assessed at a 20% capacity which is the current industry standard of operation. Fifty replications were run for each scenario to ensure a reliable 95% confidence interval for outputs.
Entry (Pick One Option):
Designating a gate on mobile tickets can reduce transmission by 3.4- 3.8%.
Designating both a gate and time on mobile tickets can reduce transmission by 24.4- 26.3%.
Customers should be encouraged but not required to adhere to the gate and time on their ticket. Effect on transmission requires majority compliance not complete compliance. The entry process should include customers joining a socially distanced queue, going through screening protocols (ticket scan, temperature check, and metal detector), then entering the stadium.
Concessions:
Implementing a mobile ordering or grab- and- go option can reduce transmission by 1.1- 1.9%.
Mobile ordering had minimal impact on transmission and implementation would be beneficial but expensive without other incentives. Operations at concessions stands should include serpentine queues with stanchions and markers on the floor to indicate social distancing both in front and behind as well as side to side. All condiment stations and tables should be removed to prevent loitering and food consumption in common areas.
Restrooms:
Closing every other stall (50% capacity) can reduce transmission by 2.1- 2.2%.
There is no restriction on sinks because waiting for sinks presents a higher risk for transmission than a using a sink in close proximity to another customer. Queues for restrooms should extend out of the restroom into the concourse with markers on the floor to mark distancing. This way, customers spend less time in an enclosed space. Entry and exit are one- way through specific doors to reduce congestion.
Concourse:
Restricting movement by assigning a designated set of restrooms, gates, and concessions can reduce transmission by 59.0- 60.2%.
This intervention allows customers to only interact with the people sitting within their section and allows customers access to each type of concession stand. Signage should be implemented to indicate where the closest restrooms and concession stands are.
All Interventions vs. None:
Implementing all customer service point interventions can reduce transmission in the concourse by 74.9- 76.2%.
There should also be increased sanitation on high- touch surfaces around the stadium. Additional recommendations are listed below.
Clubs and Suites:
Require a mask upon entry and in the common areas of the club. Stanchioned off queues for the concession areas and the restrooms should be included. Restrooms should follow the same recommendations as the rest of the stadium.
Capacity:
Capacity recommendations were determined through a sensitivity analysis. The number of customers per game is both a major revenue driver and key risk factor, so several scenarios were tested from 15% to 25% to determine transmission impact. Capacity is a tangible action to decrease stadium transmission, as a 1% decrease in capacity results in a 3.3% decrease in total stadium transmission for the capacities analyzed. A 20% recommended baseline with all interventions decreases transmission 91% from a baseline with no capacity constraints.
Project Information
Student Team
Samantha Bluth, Adam Born, Sima Fakhoury, Daniella Nieves, Emily Orton, Jacob Porter, Mitchell VanDalen, Lauren Yeap
Faculty Advisor

Faculty Evaluator