Poster
Client Context
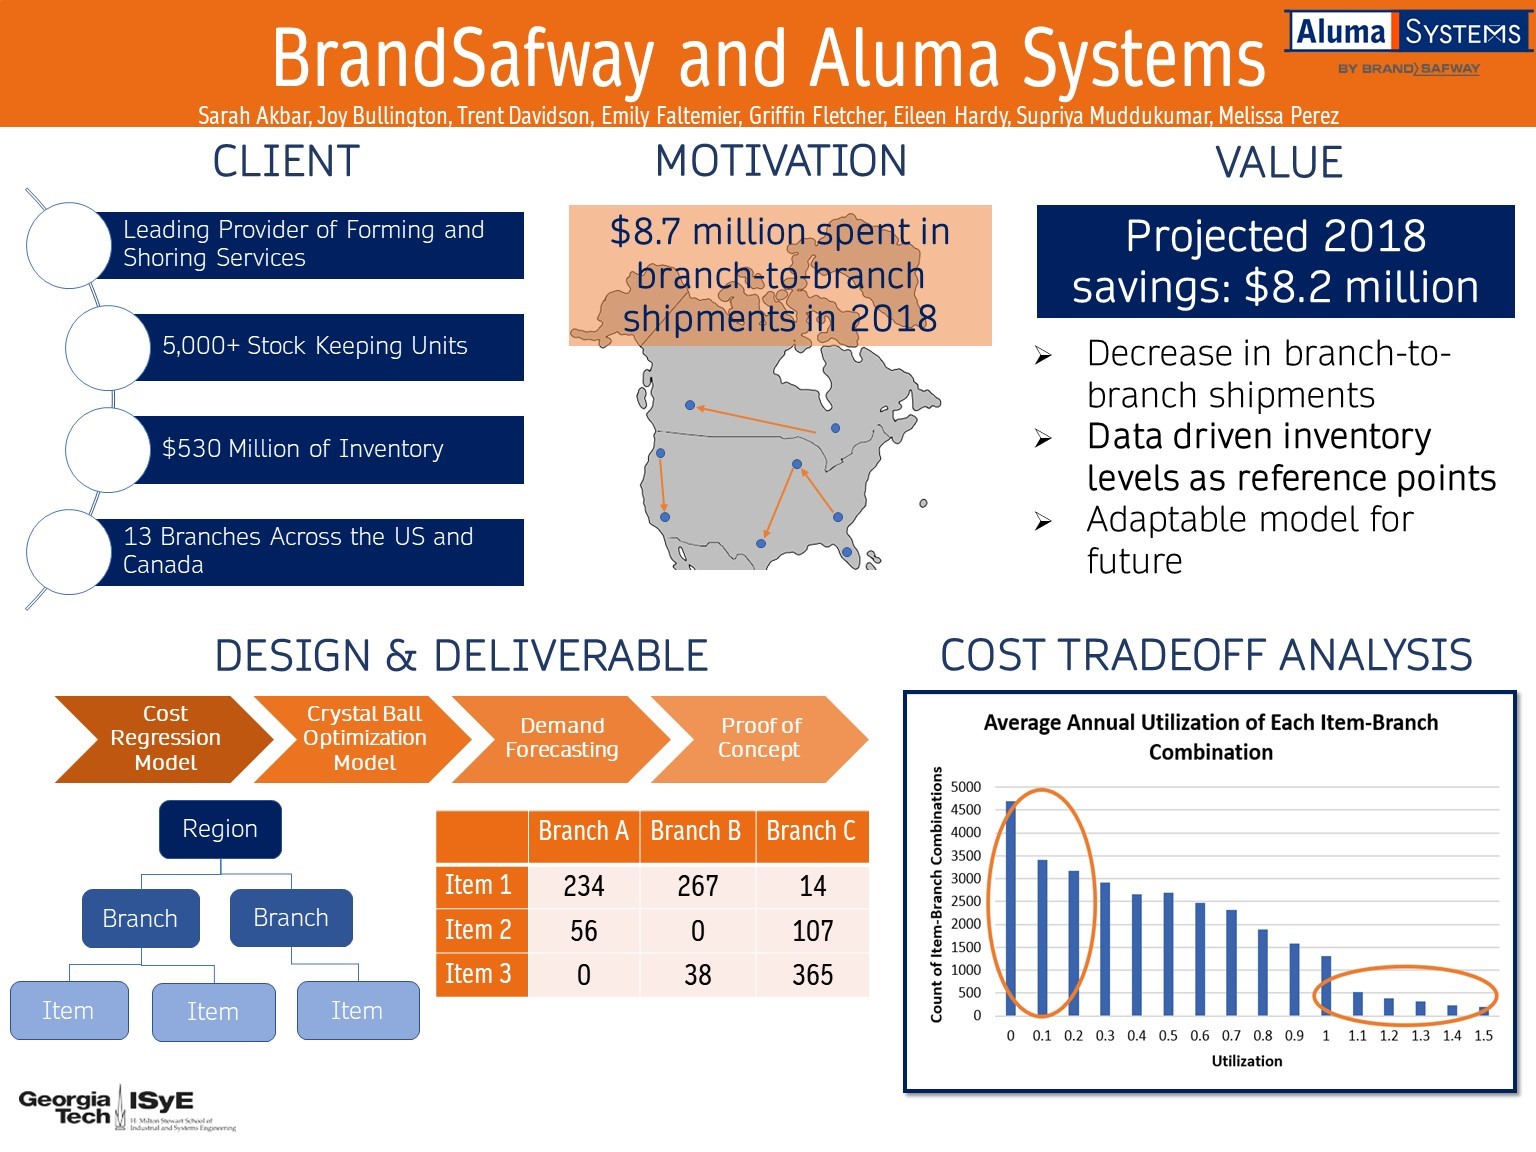
BrandSafway is a privately-owned construction and civil engineering company, headquartered in Kennesaw, GA. Aluma Systems, a subsidiary of BrandSafway, rents forming and shoring equipment for various projects such as hotels, high-rise buildings, stadiums, and airports in the United States and Canada. Aluma holds $530 million of inventory across 13 branches in North America with 5,000+ SKUs. When an order is placed, if a branch does not have all of the equipment needed for a project, Aluma must pay the transportation cost to ship the missing items from the nearest available branch in its region using a third-party carrier. These shipments are called branch-to-branch shipments.
Project Objective
In the past four years, Aluma has experienced a steady increase in their annual logistics costs. The motivation behind this project is to reduce branch-to-branch shipments, which is the leading contributor to these costs. These shipments occur when items are not located in the region where they are later demanded.
The overall objective is to determine a way to decrease the branch-to-branch shipments. One opportunity to achieve this was to analyze the inventory mix at each branch and propose new, data-driven inventory level reference points for each item that each branch can maintain.
An additional opportunity was to analyze the utilizations of individual item-branch combinations (IBCs) to identify further cost saving opportunities.
- The purpose of the first additional analysis is to identify underutilized items and offer inventory quantity changes that can result in the most cost savings. For these IBCs, there is a cost tradeoff between increasing free cash-flow by selling off excess inventory and incurring shipping costs when needed.
- The second analysis identifies IBCs with a utilization greater than 1 and generates the cost of acquiring enough new inventory to meet demand over certain periods of the year. A utilization greater than 1 indicates that a branch-to-branch shipment was required.
Design Strategy
The design strategy consists of four stages: a cost regression model, an optimization model, random demand generation, and a simulation.
Our initial solution to decrease branch-to-branch spending is a recommended inventory mix, which is a list of inventory levels for each item at each branch and regional level, generated by an optimization model. This optimization model computes the minimum branch-to-branch shipping cost the company could have achieved if they knew all demand in advance by deciding where inventory should have been initially allocated between branches and how it should have been transferred throughout the year. The model incorporates the results of a regression analysis on the cost of branch-to-branch shipments.
Using a python simulation and probabilistic future demand scenarios, the robustness and accuracy of the inventory mix is determined by analyzing the variability of the branch-to-branch costs from the simulations. The simulation acts a real-world simulation to find a realistic branch-to-branch cost savings for the future. The simulation was performed on demand variations as well as a pessimistic 20% decrease and an optimistic 20% increase in historical demand.
The additional objective, a utilization analysis, uses a python model to calculate the average annual utilization. The first analysis determines inventory changes to increase utilization to certain thresholds and for each of these inventory change values, calculates the potential cost tradeoff using the allocation costs and shipping costs for each IBC. The second analysis determines the required inventory changes to reach a fill rate of 95% and the cost of adding that inventory.
Deliverables
The final deliverable from the optimization model is a suggested inventory mix for each item type for each branch and region. These mixes will serve as reference points to maintain going forward. The deliverable is in the form of a Power BI report.
The second deliverable is a list of underutilized IBCs with inventory changes that result in the best cost savings. The third deliverable is the required inventory changes to reach a 95% and 99% fill rate and the total projected cost of the added inventory.
The optimization model and simulation also act as deliverables as they allow for what-if scenarios to be analyzed. Such scenarios include where inventory levels and/or demand are changed. The models can then predict how shifting, acquiring, or retiring inventory affects the operations of the system and estimate the costs incurred. They can also evaluate pessimistic and optimistic demand scenarios (i.e., percentage-based increases or decreases in historical demand values). If a large swing in demand is expected in either direction, the models can estimate how the system will perform as a result.
Project Information
Student Team
Akbar, Sarah
Bullington, Joy
Davidson, Trent
Faltemier, Emily
Fletcher, Griffin
Hardy, Eileen
Muddukumar, Supriya
Perez, Melissa
Faculty Advisor

Faculty Evaluator