Poster
Client Context
Aaron’s, Inc. is a lease-to-own retailer of furniture, appliances, and electronics. With over 1,100 company-owned stores across the United States, Aaron’s employs over 6,000 hourly associates, distributed among Accounts, Sales and Product Technicians teams. They are headquartered in Atlanta, Georgia.
Each store has a salaried General Manager, and then there is an Accounts, Sales, and Product Technician team. Accounts are primarily responsible for maintaining customer accounts and collecting overdue payments. Sales are responsible for assisting in-store customers as well as maintaining the showroom. Product Technicians are responsible for delivering the leased items and picking up returns and repossessions.
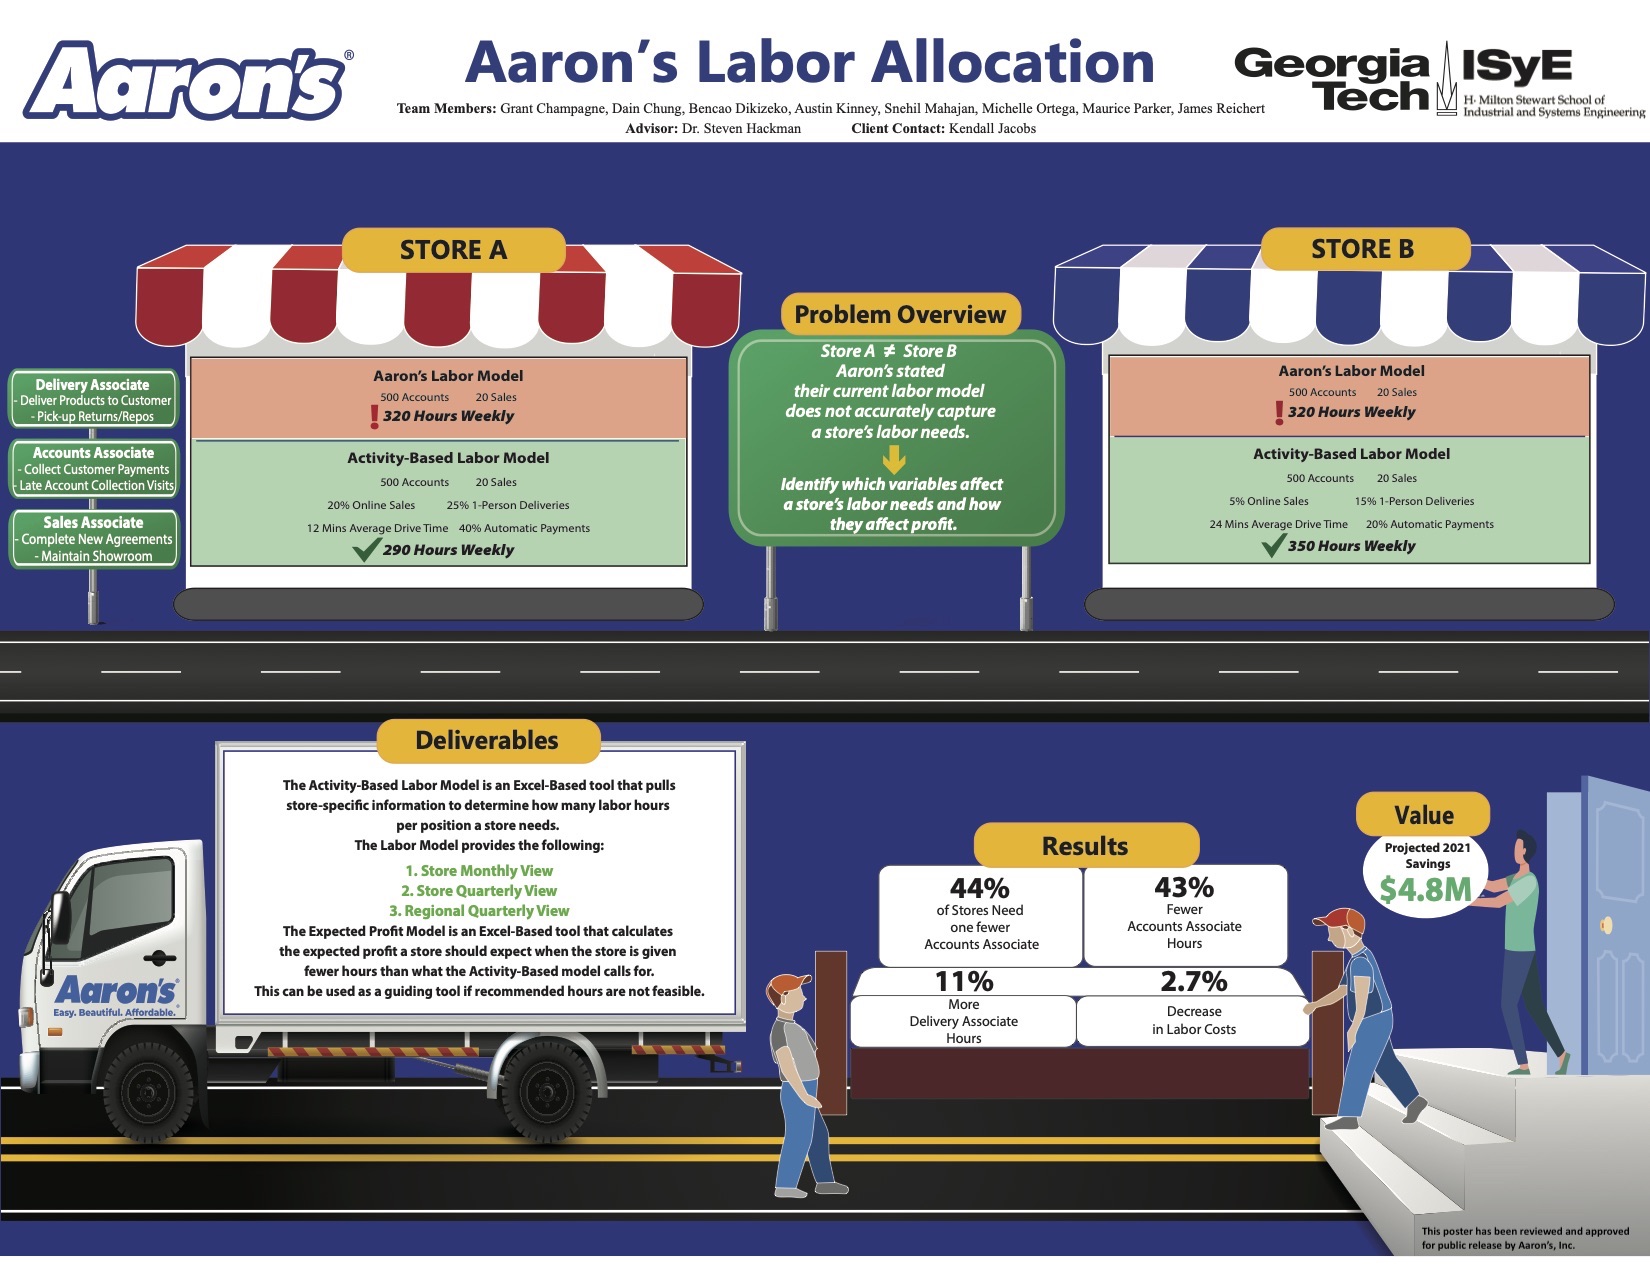
Aaron’s faced the issue of how to properly allocate labor hours to their stores. Currently, they use the customer count and expected deliveries for each store to determine how many hours a store should get weekly. They believe that their current model does not accurately calculate how many hours each store should receive for each of the three hourly teams.
Project Objective
Although customer count and forecast deliveries are the most important factors affecting the labor hours needed at an Aaron’s store, there are several underlying factors that also determine labor needed to operate a successful store. The current labor model does not account for the automatic payment rate, the number of online sales or even the number of returns a store is responsible for. It does not account for the unique characteristics of a store and only accounts for the two factors mentioned at the beginning. The Activity-Based Labor Model takes these underlying characteristics into account and finds the number of hours it should take them to complete all of the tasks they need to accomplish.
There is currently no way for an Aaron’s store to determine how they can increase expected profit. They have no visibility into the tradeoffs between changing hours and the expected profit associated with the number of hours used. They could currently be giving a store too many hours and be losing out on profit since it may be costing them more for labor than they are being successful in collecting revenue. The Incremental Profit Models display how the expected profit will change with the number of hours given to a store to do either collection calls, visits or sales.
Design Strategy
With delayed access to data, the fact that Aaron’s, Inc. was in the middle of a corporate restructuring, and the ongoing pandemic, we began with dozens of interviews with Aaron’s employees to try to understand how Aaron’s stores are currently operated and the variance among stores. The results of these interviews were weighed against the data received from Aaron’s to build a model including the most important factors and tasks influencing the number of labor hours needed to fulfill demand at each store.
The goal was to develop a labor model that estimates the labor hours needed in each of the three roles to satisfy each store's requirements. Aaron’s uses a system called “Next Up” which allows each role to cover for any other position in the store. While this is undoubtedly useful, it made modeling the system much more difficult as the roles are not deterministic. That is, overlap and “filling in” for other roles make accurate modeling more complex. Many assumptions had to be made, including how to model which tasks are best performed by each role. In the end, delineations had to be built in, such as all first collection visits being made by Product Technicians. The Activity-Based Labor Model attempts to be agnostic and estimate hours needed not based on any store’s or region’s methods in the past, but best-observed practices.
Given the very narrow window of opportunity after data was accessible, there was no time to validate the model in stores. The validation could only be done by looking at past store performance and input from Aaron’s employees. While the Activity-Based Labor Model could not be empirically validated, it is fully open and accessible to Aaron’s Store Support department to modifications and future testing. The model can be updated easily, and all assumptions and reasoning are outlined in the report.
Deliverables
Deliverables and their functionality:
1. Activity-Based Labor Model
- This is an Excel-based workbook that contains a store weekly view, store quarterly view and regional quarterly view.
- This will estimate a store’s weekly labor requirements in a given month. The goal is that these hours more closely estimate the true labor needs of each store.
- We will also provide Aaron’s a user guide, so they have a clear guideline in place to understand how to use the model.
2. Incremental Profit Models
- These are three different profit models: an incremental model for collection calls, collection visits and an incremental model for sales. All three sub models are Excel-based.
- Each sub-model calculates the expected profit for a number of hours or additional shifts (each shift is four to five hours).
- For calls and visits, the revenue is equal to the summation of the probability of a revenue-generating task being successful multiplied by the revenue per agreement for all possible calls or visits.
- For sales, the revenue is the summation of the minimum of sales associates and customers that arrive in a given hour, multiplied by the revenue per agreement and sales conversion rate, since not every customer who walks into a store equates to a purchase being made.
- Overall, these models show the General and Regional Managers how using different hours lead to different expected profits.
3. Store Benchmarking Regression
- There are two benchmarks: Expected New Agreement Deliveries (NADs) and Expected Collection Rate.
- Each is the result of a linear regression model which has been output into an Excel workbook.
- The results create new benchmarks for Aaron’s Expected New Agreement Deliveries and Expected Collection Rate, so they can compare stores based on the demographics of the store’s location and the Rapid Customer Onboarding (RCO) Tier distribution among their customers, respectively.
Project Information
Student Team
Grant Champagne, Dain Chung, Bencao Dikizeko, Austin Kinney, Snehil Mahajan, Michelle Ortega, Maurice Parker, James Reichert
Faculty Advisor

Faculty Evaluator