Poster
Client Context
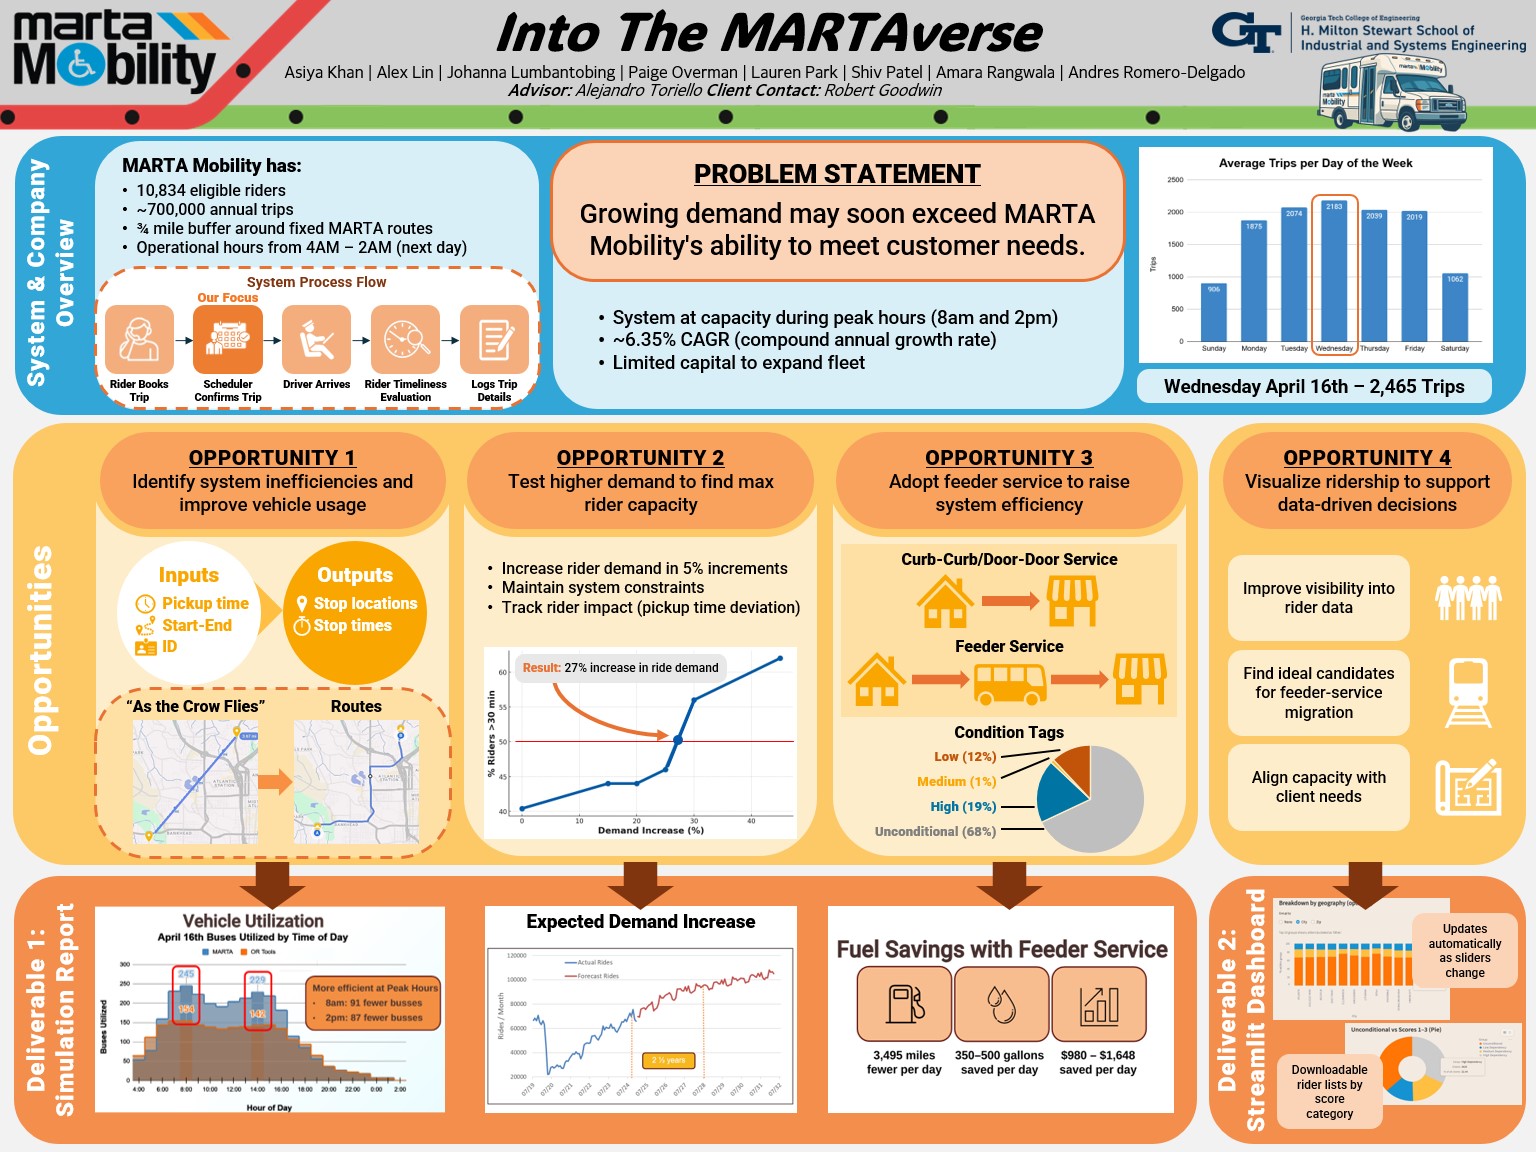
MARTA Mobility is the paratransit division of the Metropolitan Atlanta Rapid Transit Authority, providing reservation-based curb-to-curb and door-to-door transportation for riders with disabilities who cannot use MARTA’s fixed-route buses and trains. Operating across the Atlanta metro area, the system serves roughly 700,000 trips per year, relies on a fleet of 258 vehicles, and must meet ADA requirements such as next-day reservations, a ¾-mile service buffer around transit lines, and strict pickup and drop-off timing rules. Trip scheduling is handled through Trapeze, with drivers recording trip events during service. This project specifically examines the trip scheduling and routing process, which determines how vehicles are assigned, how trips are sequenced throughout the day, and how well limited resources are utilized under rising demand.
Project Objective
The objective of our project was to help MARTA Mobility better manage increasing demand without expanding its fleet, while maintaining ADA-compliant service and improving operational reliability. The client faces strong peak-hour congestion, limited vehicle availability, and no formal method for distinguishing which riders may qualify for an alternative feeder service that connects them to MARTA’s fixed-route network. These challenges highlighted opportunities to optimize the current scheduling process, understand how much additional demand the system could realistically absorb, and evaluate whether shifting eligible riders to feeder service could reduce operational strain. Addressing these opportunities is critical for improving service consistency, delaying the need for capital expansion, and ensuring that MARTA can continue meeting its accessibility mission as ridership grows.
Design Strategy
To address these needs, our team developed a simulation and optimization framework using Python and Google OR-Tools, modeling each trip as a paired pickup and drop-off subject to ADA timing windows, capacity constraints, maximum ride-time limits, and realistic travel times derived from the Atlanta street network. Because daily demand often exceeds 1,000 trips, the model used a batching approach in which trips were grouped into sets of approximately 250, optimized individually, and then recombined into full-day schedules. The model was validated by comparing results with MARTA’s actual weekday and weekend operations, ensuring all ADA rules were satisfied, analyzing system performance under controlled demand increases, and testing multiple feeder-service adoption scenarios. This approach allowed our team to capture realistic operational behavior while providing a structured environment for scenario testing.
Deliverables
Our project produced two primary deliverables: a Simulation Scenario Report and an interactive Streamlit Dashboard. The Simulation Scenario Report analyzed three areas: optimizing MARTA’s current schedule, testing the system’s capacity under progressively higher demand levels, and evaluating the operational effects of implementing feeder service for eligible riders. The Streamlit Dashboard enables MARTA to visualize ridership characteristics, assign dependency scores to condition tags, explore feeder-service eligibility, view geographic and demographic breakdowns, and export updated client lists for planning. Together, these deliverables guide MARTA in improving routing efficiency, preparing for future demand, and making informed decisions regarding service models and rider segmentation.
Value and Impact
Our project delivers significant value by identifying ways to improve scheduling efficiency without adding vehicles, enabling MARTA Mobility to accommodate up to 20 percent more demand before reaching capacity and effectively extending the system’s viability by approximately two and a half years. The feeder-service analysis shows substantial reductions in vehicle miles traveled, with even a 5 percent shift generating meaningful mileage and fuel savings that translate into $90,000 to $150,000 in annual cost reductions under typical conditions. Higher adoption levels (15–30%) can yield $300k–$870k in annual savings. Beyond financial impacts, our project supports more equitable and dependable transit for riders with disabilities, reduces unnecessary vehicle mileage, improves overall service quality, and provides MARTA with planning tools that strengthen long-term operational resilience.
Project Information
Student Team
Asiya Khan
Alex Lin
Johanna Lumbantobing
Paige Overman
Lauren Park
Shiv Patel
Amara Rangwala
Andres Romero-Delgado
Faculty Advisor

Faculty Evaluator