Poster
Client Context
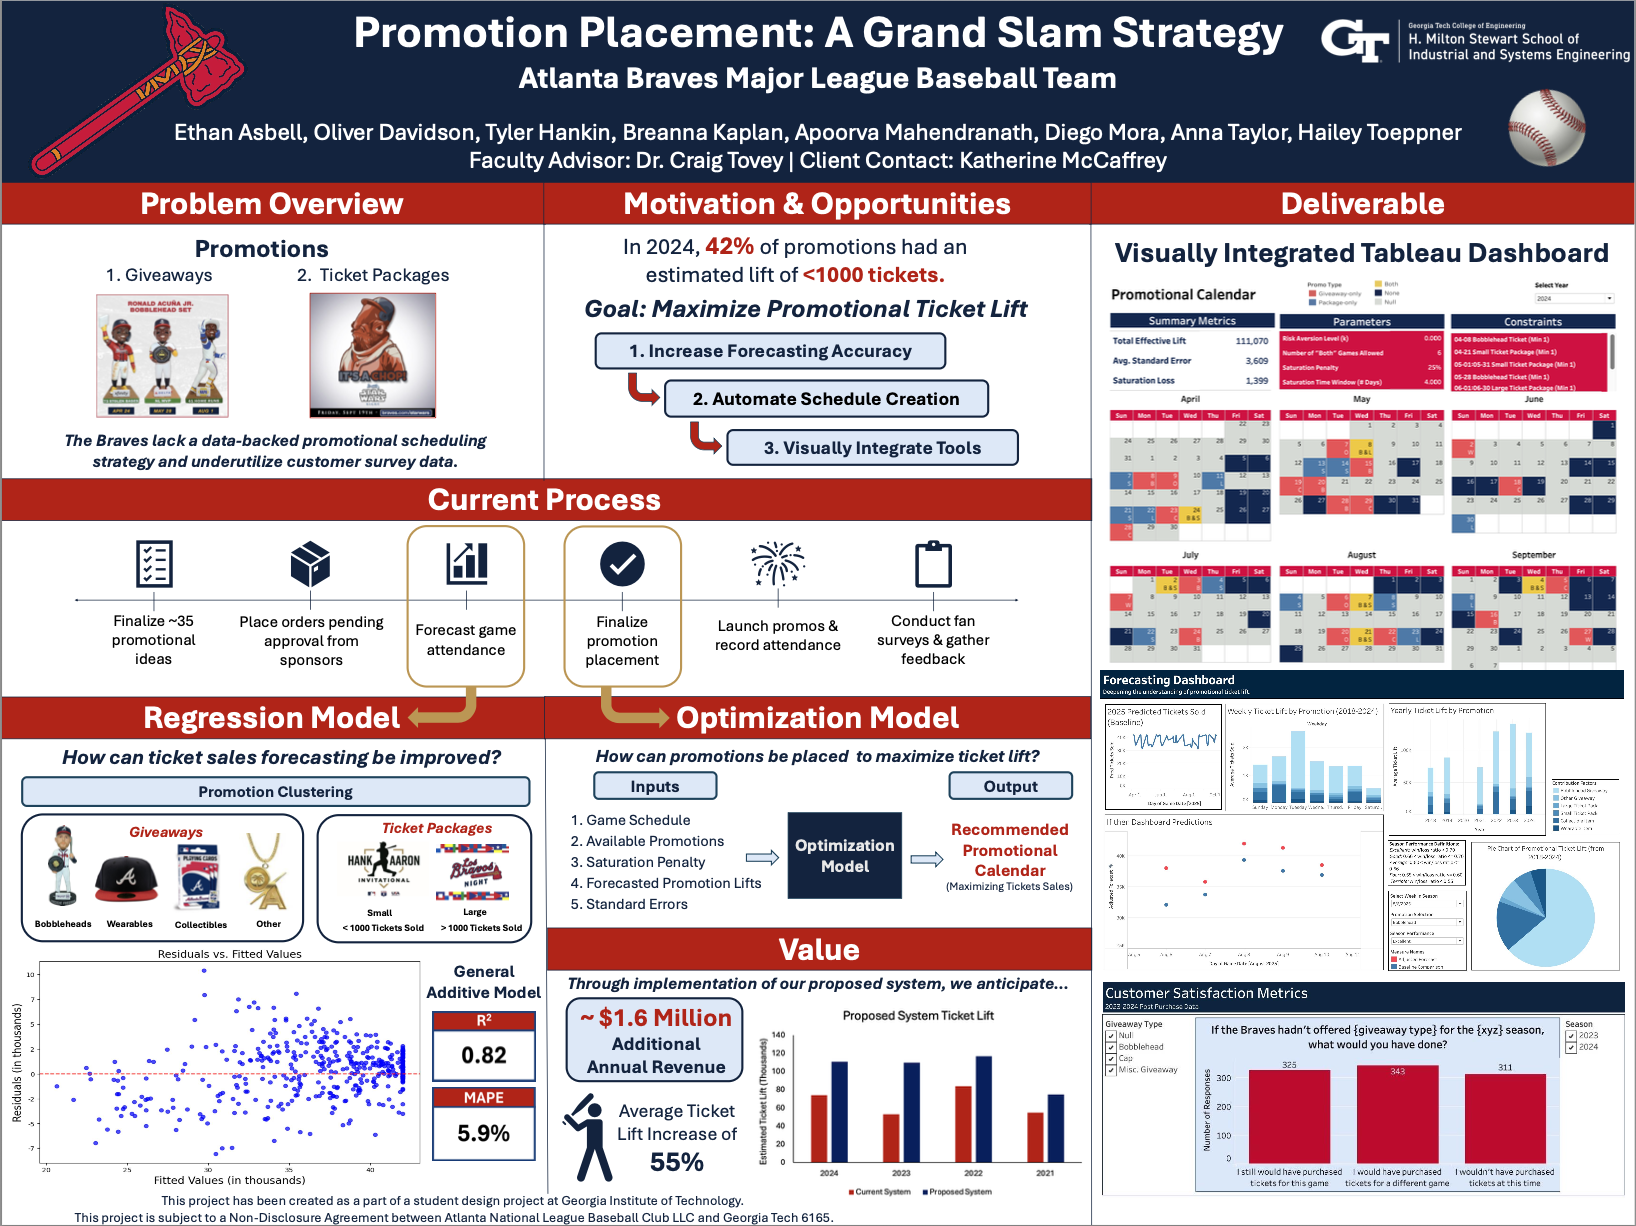
The Atlanta Braves is Atlanta’s Major League Baseball team. Each season, they hold around 80 home games at their stadium, Truist Park in Atlanta, GA. The Braves typically place approximately 35 promotions per season to incentivize fans to buy tickets to games. The promotion planning process takes many months, starting in June prior to the beginning of the season. A list of promotions is created and merchandise orders are placed. Then, in July, the Marketing & Advertising and Business Strategy & Analytics departments meet to decide which games to place promotions. This discussion is very subjective and conversational. They rely on opinions and it can take several days to finalize the promotional calendar. Once the calendar is created, the promotions are marketed to fans. Post-purchase and post-attendance surveys are sent out and the responses are collected.
Project Objective
Attendance at Braves games varies. The marketing team believes that at present they underuse historical data to account for that variability. Without a data-backed method for these placements, our client is missing out on potential tickets sold from ineffective use of promotions. Initial data analysis shows that if just a few promotions throughout the season generated a higher bucket of tickets added, the increase in revenue would be substantial. The Braves also struggle to accurately predict the lift in tickets sold due to a promotion, as the impact of individual promotion types has not been analyzed or quantified. When predictions are not accurate, like if a promotion underperforms at a game, they can create operational challenges from overstaffing to underutilized concessions, which increase costs and wasted resources. Our goal is to alleviate some of these uncertainties through the implementation of a more robust promotional placement system. Overall, this new system will aim to maintain fan engagement, optimize promotion placement, and allow the Braves to better predict tickets sold for games with promotions.
Design Strategy
To enhance the client’s promotion placement methodology, Team 8 developed a ticket sales forecasting model and a data-driven optimization model. These tools implement optimal solutions that are based on historical data of promotion performance from previous seasons. The forecasting model can quantify individual promotion lifts, and the output is fed into an optimization model. The optimization model considers all promotions and their respective lifts and places promotions on games with the objective of maximizing total ticket lift for the season. The forecasting model was validated through thorough residual analysis. The R^2 value of 0.82 and mean absolute percent error of 5.9% shows that the model is a strong fit. The optimization model was tested using sample data with only 10 games. This allowed us to test edge cases and manually check that the lift values (with saturation loss) were being applied correctly. Confidence-weighted lifts were added to the model, to ensure that the model is robust and can handle forecasting errors caused by things like data sparsity for rare game-promotion combinations.
Deliverables
The final deliverable is an interactive Tableau dashboard. The first page of the dashboard shows forecasted promotion lifts for the upcoming season and historical lifts of promotion categories from the past 6 years. When planning promotions, the Braves can use this dashboard to see how certain promotion types have previously performed and use this to inform their planning decisions. The next page of the dashboard is the recommended promotional calendar. This is the output of the optimization model. This page shows them what type of promotion they should place on which games. There are parameters on the calendar that are able to be edited by the user, such as placement constraints and number of games allowed to have multiple promotions. The Braves will be able to run the optimization model one time and be given the promotional calendar for the season. This saves lots of time in the planning process and ensures that ticket lift is being maximized. The last page of the dashboard contains several visualizations of data from the customer surveys. Questions about promotion awareness can contain important information for advertising strategies. The Braves have not previously used this data, so having it displayed visually will allow them to gain their first insights from it.
Value and Impact
This project and its deliverables have the potential to bring the Braves an approximate increase in ticket lift of $1.6 million per season, or around 55% increase in ticket lift. Through this increase, the Braves will see increases in revenue from tickets as well as merchandise and concessions. They will also have a higher level of visibility into their data around promotions, allowing them to make more data-backed decisions before and during the season.
Project Information
Student Team
Anna Taylor, Apoorva Mahendranath, Hailey Toeppner, Bre Kaplan, Oliver Davidson, Tyler Hankin, Ethan Asbell, Diego Mora
Faculty Advisor

Faculty Evaluator