Poster
Client Context
Client Description
Delta Air Lines is a leader in the flight industry with over 100 thousand employees and more than 4 thousand daily flights. Delta flies to over 280 destinations across six continents and transports an average of 2.2 billion cargo ton-miles every year.
Delta TechOps (DTO) is the maintenance, repairs, and operations division for Delta Airlines, as well as 150 other airline customers worldwide. Inventory and Logistics (IL) is a division of DTO that specializes in planning, purchasing, and tooling support services. The Domestic Outbound Shipping (DOS) division of IL, which is based in Atlanta, ships over 130 orders a day and provides shipping access to over 12 thousand different aircraft components and equipment to DTO’s 51 domestic maintenance facilities.
Part 1: Picking
The parts DOS ships are categorized as either “small” or “large.” Regardless of their size, every part is assigned a unique Handling Unit (HU) number, which acts as an identifier for each individual item and is used to track it within the system. Refer to the process flow above.
Small parts are dispensed by the Automatic Storage Retrieval System (ASRS). These parts are packed during ASRS retrieval in semi-transparent bags that are color-coded based on their priority.
-
Clear Bag: Scheduled replenishment stock parts at various maintenance facilities.
-
Green Bag: Aircraft On Ground (AOG) for scheduled maintenance.
-
Orange Bag: Hard Ground/Hot Part (a part that needs to be shipped ASAP) for unscheduled repairs and groundings due to part failures.
The scope of this project will encompass AOG and Hard Ground parts only because replenishment stock is not a priority of DOS. Once the ASRS dispenses a small part, it is automatically scanned and associated with DOS in the “PAK1-AOG” area. This part of the warehouse is responsible for organizing parts ready to be shipped out. PAK1-AOG is the main scope of the project as picking is under Internal Divisions’ supervision, not Outbound. Large parts are delivered to PAK1-AOG by forklift or elevator and then placed onto pallets labeled with their unique destination (MSP, JFK, LAX, etc.). After placing the large parts on their pallets, they are scanned to be associated with PAK1-AOG.
Part 2: Packing, PGI, and AWB
At the end of the ASRS conveyor belt, small parts are carried to the Birdie Box Packing Station. Small parts can be shipped individually or within a birdie box. At the packing station, there is a shelf comprised of 51 boxes associated with the 51 different maintenance facilities. Some of the facilities are located at the same airport; for example, there are several MSP locations denoted by MSPxxxx with four numbers at the end, representing different buildings at that destination. The small parts all have the destination location code on their HU sticker. A worker looks at this code, finds the box with that code on it, scans the box and the sticker on the part to associate the part with its Birdie Box, and then places the part bag into the box. Birdie Boxes have their own HUs, and from this moment until reaching the destination, the part is referred to by its Birdie Box HU rather than its individual part HU. Then the individual parts and birdie boxes are given a post goods issue (PGI) that updates warehouse inventory. Large parts are given a PGI after being placed onto a time slot pallet and scanned into PAK1-AOG.
When it’s time for the birdie box, individual small parts, and large parts to be shipped, each of them is given an “airway bill,” which assigns a unique code to a specific flight. This airway bill is a sticker with a barcode and the destination on it. Once the large parts are given an airway bill, they are moved to time slot pallets that are arranged in order of their destination and departure time.
All scanning information collected from within the warehouse is saved into SAP Extended Warehouse Management (EWM), which is SAP’s inventory management suite. Scanning happens when parts are picked, associated with PAK1-AOG (can be a small part coming from ASRS or a large part coming from inventory), given a PGI, and associated with an airway bill. Once the airway bill is created, all its HU’s are “closed” for use by EWM, which means that the HUs will be designated as “in transit.” The HU’s can then only be used by SAP ERP Control Center (ECC), which is the software that the destination’s Parts Receiving department uses.
Part 3: Gate Delivery
The final stage of the DOS process involves delivering parts to their designated gate. Three drivers work on a rotating schedule, with one leaving every hour to drop off parts to planes within 90 minutes of their departures. The driver collects packages from the time slot pallets and takes them to “The Dock” station to load them onto their truck.
Drivers use an application called “Springshot” to drop off parts at their designated gates. The app provides a checklist of gates and the corresponding items to be dropped off. However, drivers do not scan parts into Springshot, so no tracking information on parts is attainable. Once the driver delivers a box to a gate, it is no longer under the control of DOS. TechOps Cargo takes over the responsibility of loading the box onto the plane. When airway bills are loaded, they will be scanned one last time on board by the ground crew, saving them in the system.
Project Objective
Problem and Solution 1: No-Ride and Models
Problem
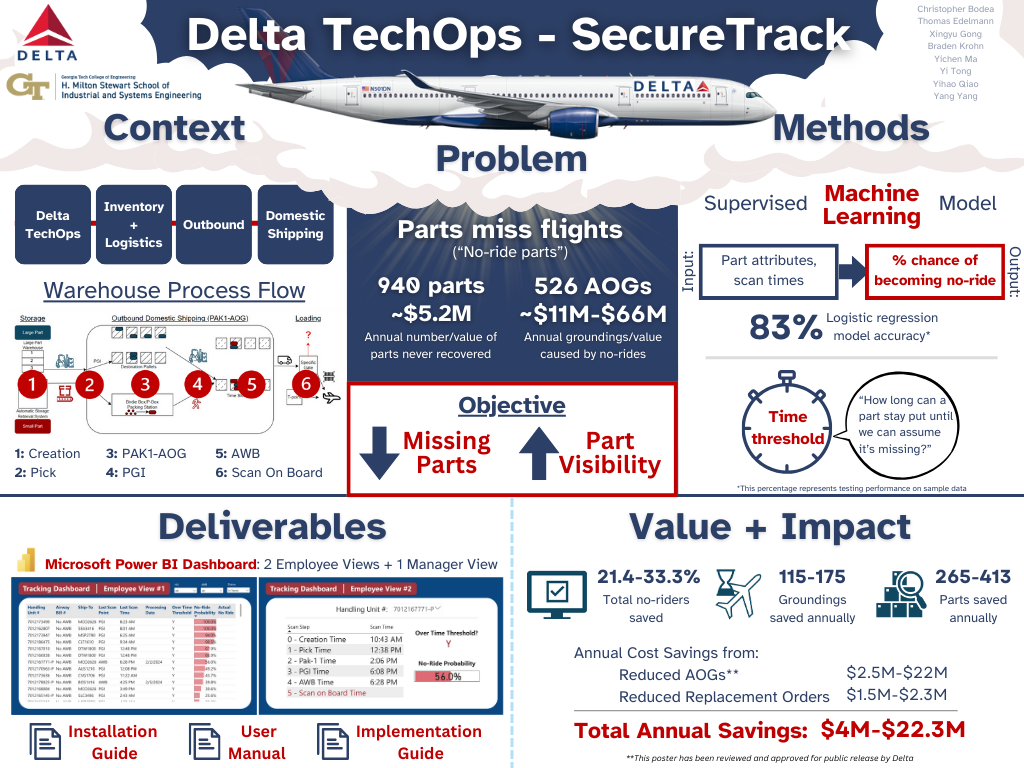
Parts from DOS do not make it onto their designated aircraft and, therefore, become no-ride items. Based on the data collected from February 1-7th, 2024, 1031 parts were shipped out, of which 90.6% (935) were delivered on time. The remaining 96 parts were classified as no-ride items, of which roughly 68% (65 out of 96) occurred within the warehouse, as these parts did not get an airway bill association. Extrapolating these values to an entire year, roughly 3,400 no-ride parts are caused within the warehouse annually.
These no-ride items can result from issues within the warehouse or at the gate. However, the focus for this project will be solely on the no-rides caused within the warehouse, as those occurring on the ramp are beyond the jurisdiction of Domestic Outbound Shipping. The parts that become no-ride within the warehouse are ones that are not successfully associated to an AWB.
No-ride parts lead to two major issues: increased costs related to ordering and shipping replacement parts and extended aircraft groundings. Based on the December 2023 Lost Tracking Data and the December 2023 Lost Tracking Overview Report, it is estimated that Delta never recovers 5.17 million dollars’ worth of parts annually. Furthermore, when parts don’t make it onto their intended aircraft, they cause extended and unplanned grounding (AOGs). Delta loses anywhere from $11,000 to $14,000 for every hour an aircraft is grounded unexpectedly. Based on the January 2024 Inventory and Logistics Report data, these 3,400 annual no-ride parts are estimated to lead to 526 AOGs annually, costing Delta anywhere from 11 to 66 million dollars per year.
Solution
No Rider Identification
Within the current system, it can take multiple days for DOS to identify that a part is a no-ride. The goals of the following models are to quickly identify and correct no-ride parts.
Proactive Modeling
The proactive model predicts potential no-ride parts prior to becoming no-ride. The model is a logistic regression model that takes predictor variables and returns the probability that a part is no-ride. Logistic regression was specifically chosen because it is an interpretable, not black box, supervised machine learning algorithm. Logistic regression models output a series of coefficients that can be used for matrix calculations within a Microsoft Power BI dashboard. Simple matrix calculations are less computationally intensive than rerunning a different model each minute the dashboard refreshes. This model had one of the best performances and a good balance between the number of no-riders correctly identified and the total number of parts identified as no-ride.
The predictor variables are time intervals, inventory sources, and destinations. Each of the intervals are quantitative variables while inventory sources and destinations are qualitative variables. The numerical values for the length of time at each station are calculated by differences between sequential time stamps at order creation, picking, entering PAK1AOG, and receiving PGI. These define the three-time intervals. The response variable is no-ride outcome, with a one indicating no-ride and a zero indicating successful loading.
From the full model on an 80/20 train test split, using 10-folds cross-validation, the significant quantitative variables are time intervals, order creation to picking and PAK1 to PGI. The significant qualitative variables are destinations and activity areas: DTW1800 (Detroit), JFK2326 (New York), LAX2436 (Los Angeles), activity areas A02 (source ASRS), and 4000 (oversized parts).
The features with the most positive importance are destination JFK2326, destination LAX2436, activity area A07, activity area A04, activity area A02, destination MIA2696 (Miami), and destination DCA1730 (Arlington).
A hypothesis test for overall regression yielded a p-value of 0. At least one of the estimators of the predicting variables is significantly different than 0. A goodness of fit hypothesis test yielded a p-value of 1. The logistic regression model is a good fit for the data. A hypothesis test on independent outcomes yielded a Durbin Watson statistic of 2. There is little to no positive or negative autocorrelation within the model.
The model had an overall accuracy (correctly classified parts) of 83%. The output probabilities are classified binarily using a threshold of 10%. The correct identification of no-rider parts is 28.57%. The percentage of parts checked is 14.55% (~ 21 parts/day). A lower threshold causes a larger number of misclassifications, parts checked daily, and correct no-ride identifications. A 10% threshold balanced these attributes best.
Reactive Modeling
The second model is a reactive method that identifies parts that have spent too much time between stations. This method utilizes distribution analysis to determine a time threshold that is unlikely for a part to spend at a station. There are 6 main scanning stations within the current system: order creation, picking, entering PAK1-AOG, receiving PGI, receiving AWB, and loaded on board, leading to 5-time intervals in total.
The first three thresholds are calculated using the 95th quantile which focuses on extremes within the dataset. The last two intervals had a much greater overall spread in their distributions. If a 95th quantile was used in this scenario, the threshold would be much too large to provide any benefit to the current system. Therefore, these thresholds are calculated using the Q3 or 75th quantile added to 1.5 times the interquartile range (IQR). These thresholds result in about 286 checked parts a week or about 40 a day. Therefore, the combination of the two methods at max would require about 62 parts a day. However, this number will be smaller because the two models are not mutually exclusive.
Design Strategy
Problem and Solution 2: Visibility and Dashboard
Problem
DOS lacks visibility in its entire system. Currently, DOS uses three different data management systems that do not communicate effectively, which results in gaps in data throughout the part process. After a package leaves the warehouse, DOS no longer has any information within their primary EWM SAP system. Although DOS can look up an Airway Bill one by one and associated flights to see whether a package made it on the plane, there is no all-in-one visual confirmation to ensure the packages are dropped off at the correct locations. This presents an even bigger issue when it comes to Shift Leads searching for lost parts, as they must look through each of the three systems to determine where a part is before spending countless hours looking for it all over the warehouse. Moreover, there is no notification to DOS that a part has become a no-ride, which can lead to delays as it may take days before customers call to inform DOS that the part has not arrived. This delay results in more opportunities for a part to become lost as the time to notify is so long.
Solution
The dashboard’s intended purpose is to enhance visibility within the system by connecting the SAP EWM and ECC databases into one common source. As seen in the “Employee View 2” below, this allows for DOS to see all recorded timestamps of a part throughout the system. Previously, DOS would have access until the AWB association, but they would have to look up the specific AWBs one at a time to see whether the part was successfully loaded.
The dashboard also functions as a medium for the average DOS employee to interact with and utilize the models explained previously. As seen in “Employee View 2,” the probability of being a no-rider output from the logistic model is displayed, as well as whether the part has exceeded the time threshold at its most recent station.
“Employee View 1” displays a list of all parts shipped. For each part, their HU, AWB number, destination, last scan point and time, date, threshold evaluation, logistic regression probability, and outcome are displayed. In the top right, there is a status button that allows the user to filter by parts currently in transit, which is the most practical application. Previously, individual parts were looked up in the SAP EWM system one by one. Now, an overview of all the parts currently within the system can be displayed. This view also allows for sorting based on no-rider probability, which applies priority to parts’ recovery. The dashboard, more specifically this view, helps find parts before they become a no-ride.
The “Manager View” displays the overall health metrics of the system at large. This allows a manager to see the current values in lost parts, as well as the number of no-rides and the reason for no-rides daily. While previous reports would show a given week or month, this view can be used to select any date range in the top right corner. This allows for a better understanding of the trends within lost and no-ride parts.
Implementation
The first step in implementing the Power BI Dashboard solution is integrating it into Delta’s system. Delta’s first step will be to set up periodic pulls from the databases from which the team collected the Feb. 1-7 data and export these pulls into a central storage location. Assuming DOS can get all required files in their respective specified formats, they would just input the file locations into Power BI, and everything will update. The main three data files they would need are (1) “Full Kitting,” which is a list of all parts from creation to fulfillment with their basic attributes, including Handling Unit Number, Creation Date, and Ship-To Location; (2) “No Ride,” which is a list of all parts within a given time frame that did not make it onto its designated flight; and (3) “Lost Tracking,” which is a list of all material numbers that have been credited and debited into/out of their inventory due to part loss.
Once Delta has the dashboard up and running, they will use it to monitor parts in transit through the warehouse. A shift lead would monitor the dashboard on top of their normal duties (this was confirmed by our client contact). The employee would first rank the data in Employee View #1 by “No-Ride Probability” from high to low. If there are parts on the list with over 10% probability or “Y” for “Over Time Threshold,” the employee would select this part’s HU number and input it into the search bar on Employee View #2. They will then search for this part between the last scanned location and the next scan location on the agenda (i.e., between Picking and PAK1-AOG) and also around PAK1-AOG. If found, the employee will ensure that the package receives all necessary associations (AWB, PGI, etc.) and move the package to the next station. Otherwise, the employee will notify management about the missing part.
The final deliverable is a folder with the Power BI file, Dashboard Manual (which includes the Integration, User, and Implementation Guides), and sample data, which is all Delta needs to get our solution up and running.
Deliverables
Validation
The overall number of no-ride parts identified by the logistic model is 28.57%. A Monte Carlo simulation is used to create a digital replica of the current system to measure the percentage of no-rides corrected. Important metrics like the total number of parts not loaded, the total number of orders, the total number of parts without an AWB, and the percentage of parts that become no-ride, all per week, are considered. The simulation procedure resulted in 95% confidence intervals over 52 replications for the mean of each of these values per week. Each confidence interval captures the actual observed historical values respectively. This means that the simulation is an accurate representation of the current system.
Simulated daily system metrics and identification rates from the logistic model are used to determine the overall percentage of no-ride parts corrected. From the simulated new system, a 95% confidence interval for the mean percent reduction in no rides was found to be 21.44% to 22.43%.
Looking at the reactive threshold model, 100% of all no riders within the warehouse are identified because having no AWB association will result in an infinite time. Using historical data and the four calculated thresholds to determine the percentage of no rides identified at each station, the following values are achieved: 7.69%, 6.15%, 9.23%, and 76.92%, respectively. From historical data in the Lost Tracking Report, 24% of all lost parts are recovered. This calculation includes both inside and outside the warehouse. Therefore, it is a very conservative assumption to conclude that 24% or roughly 88 of the identified parts will be recovered. After these parts exceed the threshold and are recovered, not all of them will still be able to reach their designated flight. Based on historical data, the percentage of parts that are able to be scanned on board after receiving a threshold alert is 64.1%, 59%, 72.1%, and 39.3%, respectively. This yields an overall reduction in no-ride parts of around 10.9%.
As stated earlier, 21.44% to 22.43% of no-ride items will be saved using the logistic regression model, and 10.9% of no-riders will be saved using the threshold model. This leads to a combined savings of 21.44% to 33.3% of no-riders saved as the model may or may not overlap in identifying no-riders based on different circumstances.
Value and Impact
Value and Impact
Decrease in Number of Aircraft Grounded due to No-Rides
No-ride parts impact Aircraft On-Ground (AOG) situations, as unexpected maintenance and repair periods occur when a part does not arrive on time. Using the "Inventory and Logistics Daily Report" for January 2024 and extrapolating these values to a year while considering the percentage of domestic flights and the number of parts shipped out by Dangerous goods, it can be expected that there are roughly 526 AOG occurrences annually due to DOS no-ride parts. 346 AOG occurrences are more than three hours, and 180 AOG occurrences are greater than three hours. Based on the validation, 21.44% - 33.3% of no-ride parts will be saved using the dashboard, decreasing the number of AOGs by 115 to 175.
To be conservative while estimating the cost savings, upper and lower bounds are used wherever possible. The estimate of the average operating cost per hour for an aircraft that is unexpectedly grounded was calculated to be $10,551 to $14,068, then validated using a Boeing estimate. For estimating the time an aircraft is grounded, a lower bound of 15 minutes was used for AOGs less than three hours, and exactly three hours was chosen for AOGs more than three hours. For the upper bound, three hours was used for AOGs less than three hours, and 12 hours was selected for AOGs more than 3 hours. The upper bound of 12 hours was chosen to account for maintenance time, testing, and returning to service which was equivalent to one day of service. These numbers are then multiplied by the number of AOG occurrences for their respective times to get a range of $11.43 million to $66 million. Finally, this range was multiplied by the percentage of no riders that could be saved (21.44% to 33.3%) to get a final estimate of $2.45 million to $22 million per year.
Decrease in Spending related to Ordering Replacement Parts
No-riders lead to an increase in the need to ship replacement orders. If a no-ride part is expendable, the outbound team will immediately ship a new part before even looking for the lost one as the time spent looking and placing the part back into inventory is not worth it. For nonexpendable parts, DOS shift leads will search for the part for the next 48 hours before shipping a new part to the customer. Unlike with the expendable part, if the non-expendable part is later found, it will be rebooked into inventory if it is returned to the DOS warehouse instead of being discarded, resulting in the cost of the extra part is not incurred.
Based on the “Lost Tracking Overview” report from January 1, 2023, to December 31, 2023, $5.2 million worth of parts were lost and not recovered. Using the December 2023 Lost Tracking Report, only 24% of the parts are recovered, of which all are recovered within 48 hours. Parts are deleted from the Lost Tracking Report after an “unspecified amount of time” and are then counted as a loss to maintain inventory accuracy. By dividing the lost parts' value ($5,170,495) by 0.76, it can be estimated that $6,808,658 worth of parts were lost in total. The dashboard's implementation is expected to reduce the number of parts lost between 21.44% to 33.33%, resulting in annual savings of around $1.46 million to $2.27 million.
Other
DOS will experience faster recovery rates for no-ride parts with the new dashboard system. The current process of relying on customer complaints is slow and can take days, making it difficult to locate the missing part. However, the new system will notify the team within seven hours and display scan time in one location, making it easier to locate the part. This will lead to higher recovery rates and free up more time for important tasks in the warehouse.
Delta often charters emergency flights when a part is urgently needed in a location where no other passenger flights are scheduled to go that same day. This can cost up to $30,000. The new dashboard will minimize the need for emergency flights by reducing the instances of no-ride parts and reducing the number of situations where an emergency flight is required.
Lastly, Delta customers will benefit from a better overall customer experience. With the dashboard leading to a decrease in the number of no-ride parts, there will also be a decrease in the number of AOGs, meaning fewer delays and cancellations, more on-time arrivals, and an overall better customer experience for Delta passengers.
Project Information
Student Team
Christopher Bodea
Thomas Edelmann
Xingyu Gong
Braden Krohn
Yichen Ma
Yi Tong
Yihao Qiao
Yang Yang
Faculty Advisor

Faculty Evaluator